Introduction
Socket statistics, particularly through the ss utility in Linux, reveal much about the health and efficiency of your network connections. These statistics allow you to see how sockets are behaving in real-time, providing insights that can be vital for maintaining optimal performance.
When you run the ss command, you gain access to a wealth of information, including the number of established connections and the current states of various sockets.
Understanding how to interpret these statistics can empower you to make informed decisions about managing your networking resources.
For server environments that require adaptable resources to handle varying load, explore Webdock’s fully flexible Linux VPS servers.
This article will explore the intricacies of socket statistics, focusing on how to effectively use the ss command to monitor and analyze your network performance.
Socket Statistic vs. Netstat
Two commonly used utilities for understanding network connections are ss (Socket Stat) and netstat (Network Statistics).
Both tools provide insights into socket connections, but they have distinct features and capabilities. Talking about these tools brings the red and blue pill scene from The Matrix in mind because, for each tool, there are people who have strong opinions.
So, let’s explore the strengths and weaknesses of each tool.
ss (Socket Stat)
Pros
- Speed: Executes quickly, providing real-time data about socket connections without the overhead of legacy code.
- Detailed Output: Offers extensive information about socket states, including TCP, UDP, and UNIX sockets, making it more informative than some alternatives.
- Filtering Options: Includes advanced filtering capabilities, allowing users to refine output based on specific criteria.
- Active Connections: Displays active connections and listening sockets in a clear format, helping to diagnose issues swiftly.
Cons
- Learning Curve: May require some time to understand the output and options available for new users.
- Less Familiarity: Some users may be more accustomed to using netstat, leading to a preference for that tool.
netstat (Network Statistics)
Pros
- Familiarity: Widely used and understood, making it easier for many users to interpret its output.
- Broad Functionality: Provides a range of network statistics, including routing tables and interface statistics, in addition to socket information.
- Legacy Support: Works on a variety of systems and is often already installed, making it readily accessible.
Cons
- Slower Performance: Generally slower than ss, especially when dealing with a large number of connections due to its older architecture.
- Limited Detail: May not provide as much detailed information on socket states as ss, which can hinder in-depth analysis.
- Deprecated in Some Systems: In some Linux distributions, netstat is being phased out in favor of ss, leading to potential compatibility issues in the future.
Choosing ss over netstat is like choosing a microwave over an oven. ss heats up your results instantly with all the details you need, while netstat takes its time give you the same info (eventually). Your choice between the two should depend on your specific needs and comfort level with each tool and not what strangers on the internet defend.
Using Socket Statistics (SS)
The ss tool is included in the IPROUTE2 Utility Suite, which is commonly pre-installed on most Linux distributions. This means you typically don’t need to install it separately. On Debian-based systems, you can find the ss executable located in the /bin directory.
If you discover that ss is not available on your system, you can easily install it by installing the iproute2 package. This package contains a collection of utilities for managing networking in Linux, including ss, which provides detailed information about socket connections:
$ sudo apt-get install iproute2
The simplest way to use the ss command is by running it without any parameters:
$ ss
This will display a list of open sockets that are actively connected but not in a listening state.
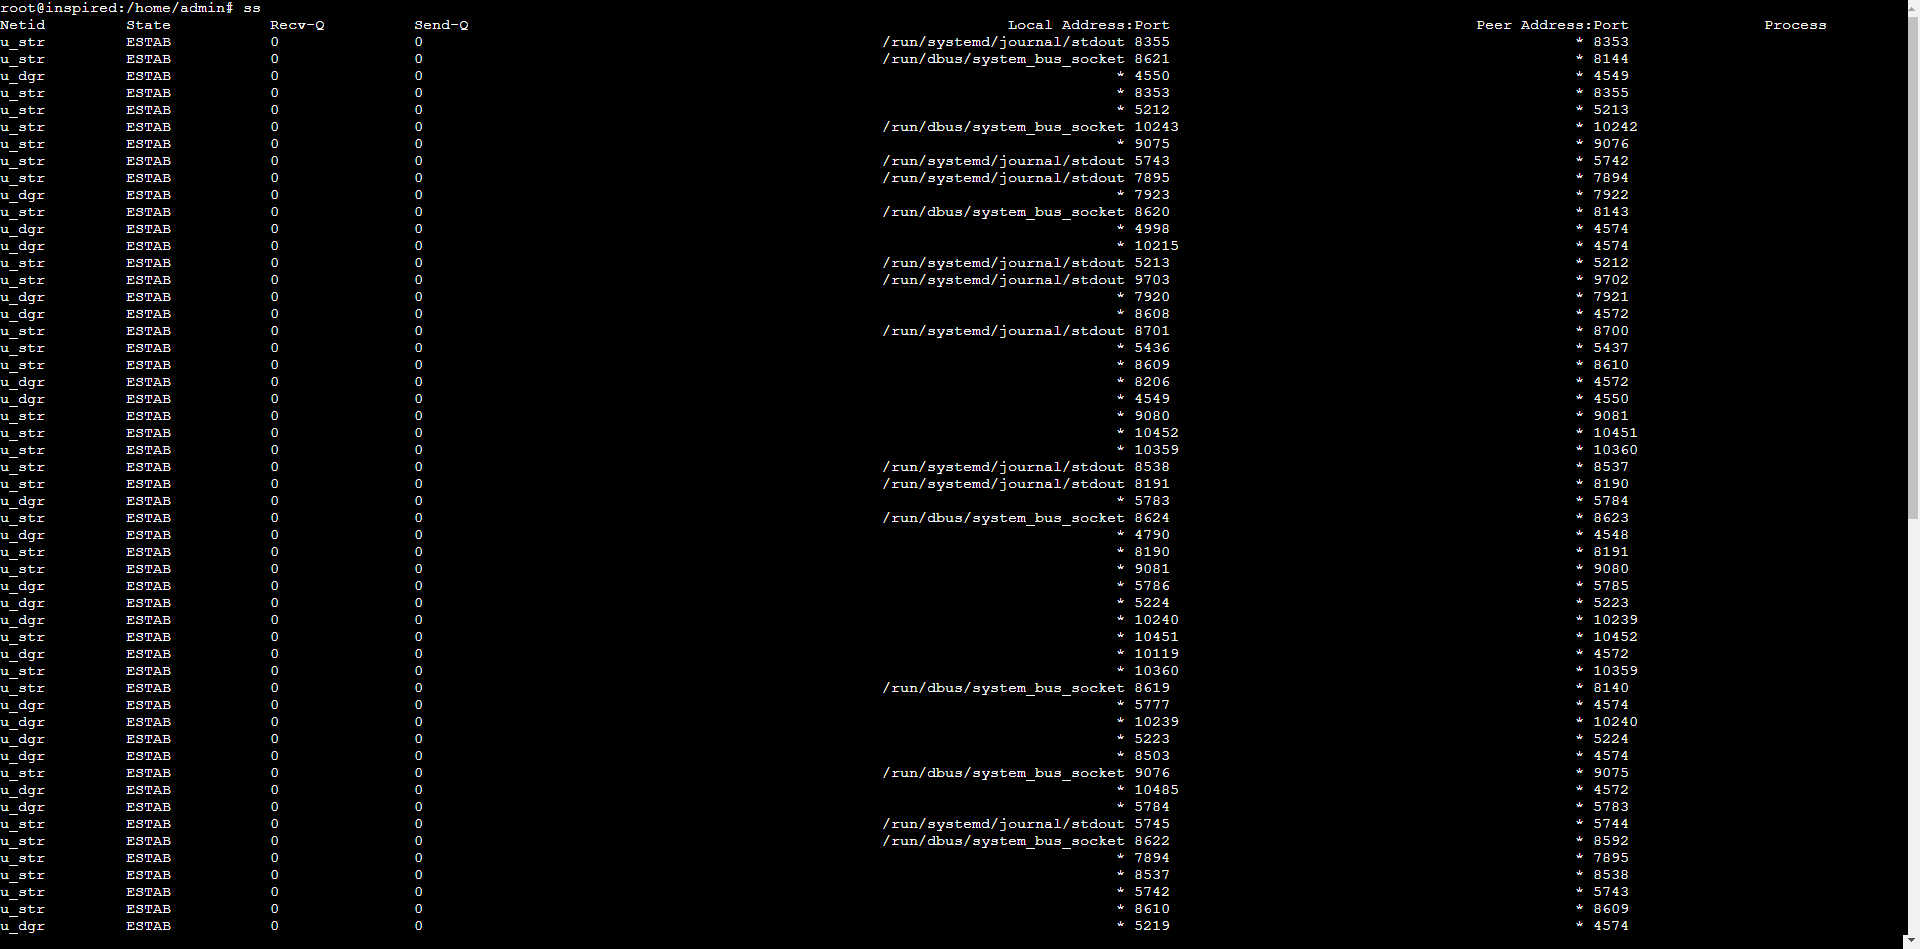
- Netid: This column indicates the type of socket. Common types you might encounter include:TCP: Transmission Control Protocol, which is designed for reliable, ordered, and error-checked delivery of data between applications.UDP: User Datagram Protocol, which allows for faster data transmission without the overhead of connection management or guaranteed delivery.u_str: Unix stream sockets, used for bidirectional communication between processes on the same machine, enabling efficient data exchange.
u_seq: Unix sequence sockets provide a connection-oriented service for message-oriented communication.
- State: This column displays the current state of each socket, indicating its activity level. Some common states are:ESTAB (Established): The socket is actively connected and can send and receive data.UNCONN (Unconnected): The socket is not currently connected to any peer, indicating that it is idle.LISTEN: The socket is waiting for incoming connection requests and is ready to accept new connections.
- Recv-Q: This represents the number of packets that have been received but not yet processed by the application. A high value in this column may suggest that the application consuming these packets is overburdened or unable to keep up with incoming traffic.
- Send-Q: This column shows the number of packets that have been sent but not yet acknowledged by the receiving side. A significant number here could indicate issues such as network congestion or problems with the remote connection.
- Local address:port: This displays the IP address and port number of your local machine, identifying where the socket is bound. It helps in understanding the specific endpoint on your system that is involved in communication.
- Peer address:port: This indicates the IP address and port number of the remote machine with which the socket is communicating. It provides context about the external endpoint involved in the connection.
When you run the ss command without using sudo, the output is limited to the sockets that are accessible to the current user. This means you will only see information about connections and sockets that the user has permission to view.
For example, if a user runs ss without root privileges, they may only see their own active connections and not those of other users or system services. In contrast, executing the command with sudo provides a comprehensive view of all sockets on the system, including those belonging to other users and critical system processes. This distinction is important for troubleshooting and monitoring network activity effectively.
Getting More Out Of The SS Command
Getting the most out of the ss command helps you tap into its full potential for network analysis. Let’s take a look at some of its popular flags:
- -4: Restricts display exclusively to Internet Protocol version 4 connections.
- -6: Filters results to show only Internet Protocol version 6 connections.
- -a: Expands visibility to encompass all socket types, regardless of connection status.
- -A: Enables custom socket type filtering with support for various identifiers including: all, inet, tcp, udp, raw, unix, packet, netlink, unix_dgram, unix_stream, unix_seqpacket, packet_raw and packet_dgram.
- -d: Narrows focus to display only DCCP protocol sockets.
- -D FILE: Redirects generated output to a specified document rather than displaying on screen.
- -e: Activates enhanced information mode with comprehensive socket details.
- -f FAMILY: Constrains output to a specific socket family type, with acceptable values being unix, inet, inet6 and netlink.
- -h: Provides access to the complete reference guide listing all available parameters.
- -H: Eliminates the descriptive header line, facilitating automated processing via scripting languages.
- -l: Reveals passive sockets awaiting incoming connections, which standard views typically exclude.
- -m: Incorporates memory utilization metrics for each socket.
- -n: Disables translation of service identifiers to their corresponding names.
- -o: Incorporates timing information across five categories: connection establishment, keepalive maintenance, connection termination, zero window probing, and miscellaneous timers.
- -p: Reveals which system processes are utilizing each socket.
- -r: Toggles domain name resolution functionality, which remains inactive by default.
- -s: Generates comprehensive statistical analysis of current network connections.
- -S: Limits display to only SCTP protocol sockets.
- -t: Creates a TCP-specific view by filtering out other protocols.
- -u: Produces a UDP-focused display by removing non-UDP connections.
- -V: Identifies the installed software version.
- -x: Constrains output to display only UNIX domain sockets.
Advanced Network Inspection with Socket Statistics
These commands reveal what’s actually happening in your Linux network stack. I’m skipping the basic -a and -t flags you already know – this is about the specialized options that expose real issues. Track socket queues filling up before they cause timeouts.
Spot unusual connections on your ports when nobody should be hitting them directly. See which processes are hogging localhost connections. When standard tools leave you clueless, these SS insights cut straight to the problem.
Note: Some commands may need to be run as root. In that case run “sudo su” before running the netstat command.
Display Socket Summary Statistics
$ ss -s
This command provides a summary of socket statistics, showing counts of different socket types and states. Useful for getting a quick overview of your system’s network usage patterns.
Show Only IPv4 TCP Sockets in ESTABLISHED State
$ ss -4t state established
Lists only IPv4 TCP connections that are in the ESTABLISHED state. Helps focus on active connections when troubleshooting in busy environments.
Display Timer Information with Socket Data
$ ss -o state established
Shows all established sockets with their timer information, including how long connections have been established and timeout values. Valuable for identifying stale or long-running connections.
Show Connections to SSH Port
$ ss -tn dport = 22
Displays all TCP connections to port 22 (SSH) with numeric addresses. Useful for monitoring SSH connection attempts to your system.
Show Internal TCP Sockets
$ ss -t src 127.0.0.1
Lists all TCP sockets with a source address of localhost. Helpful for troubleshooting local services and inter-process communication.
Display All Listening Sockets with Process Info
$ ss -ltp
Shows all listening TCP sockets along with their associated processes. Excellent for security audits and identifying what services are running on your system.
View All Connections to Web Servers
$ ss -tn dport = 80 or dport = 443
Displays all TCP connections to HTTP and HTTPS ports. Useful for monitoring web traffic to your servers.
Display Memory Usage for Sockets
$ ss -m
Shows memory usage information for sockets, including buffer sizes and memory allocation. Valuable for diagnosing memory-related network performance issues.
List All UDP Sockets with Process Info
$ ss -up
Displays all UDP sockets along with the processes using them. Helpful for monitoring DNS, DHCP, and other UDP-based services.
Show Sockets in TIME-WAIT State
$ ss -n state time-wait
Lists sockets in the TIME-WAIT state with numeric addresses. Useful for diagnosing connection termination issues and socket reuse problems.
Display All Unix Domain Sockets
$ ss -x
Shows all Unix domain sockets, which are used for inter-process communication on the local system. Helpful for understanding how local processes communicate.
View Sockets with Non-Zero Receive Queue
$ ss -t state established recv-q ne 0
Lists established TCP sockets that have data waiting to be processed in their receive queues. Helps identify potential bottlenecks in data processing.
Display Sockets with Non-Zero Send Queue
$ ss -t state established send-q ne 0
Shows established TCP sockets with data in their send queues, indicating potential network congestion or slow receivers.
List Sockets Based on TCP State
$ ss -t state fin-wait-1
Displays TCP sockets in the FIN-WAIT-1 state. Useful for identifying applications with connection termination issues.
Find Connections from Specific IP Address
$ ss dst 192.168.1.100
Lists all connections to or from a specific IP address. Helpful for tracking communication with particular hosts.
Show TCP Connections to Database Server
$ ss -tn dport = 3306
Displays all TCP connections to MySQL port (3306). Useful for monitoring database connection activity.
List All IPv6 Listening Sockets
$ ss -6l
Shows all IPv6 sockets in the listening state. Helpful for verifying IPv6 service availability.
Display HTTP Connection States
$ ss -o dport = 80 or sport = 80
Shows all HTTP connections with their timer information and states. Useful for web server diagnostics.
Show All Network Namespaces (with root privileges)
$ ss -n --all
Displays sockets across all network namespaces. Particularly useful in containerized environments or with network virtualization.
Count Connections by State
$ ss -tan | grep -v LISTEN | awk '{print $1}' | sort | uniq -c
Counts TCP connections grouped by their state. Provides a quick overview of connection distribution across different states.
In Conclusion
Socket statistics tools like ss give you valuable insights into what’s happening within your network connections. By analyzing these metrics, you can quickly identify bottlenecks, monitor system health, and troubleshoot issues before they impact performance.
When choosing between ss and netstat, the debate reminds me of the vim vs nano arguments. Both accomplish similar tasks with different approaches but don’t get caught up in this choice. What truly matters is understanding what the output tells you about your network’s behavior.
As you become more familiar with these commands, you’ll appreciate how they reveal connection states, memory usage, and process relationships. The real power comes when you can interpret what those numbers mean for your system’s health.
Try experimenting with some of the advanced flags mentioned in this article. Each provides a unique perspective on your network activity that might just help you solve that tricky performance issue you’ve been battling.
Meet Aayush , a WordPress website designer with almost a decade of experience who crafts visually appealing websites and has a knack for writing engaging technology blogs. In his spare time, he enjoys illuminating the minds around him.
