Introduction
This guide includes the step by step procedure of installing different packages like prometheus, grafana, node exporter and alert manager to monitor system resources and generate alerts when a system metric crosses a specific threshold.
Prerequisites
- Webdock cloud Ubuntu instance (18.04 or later)
- You have shell (SSH) access to your VPS
Installing Node Exporter
First, add a node_exporter user with no login permission and without home directory.
$ sudo adduser --no-create-home --disabled-login --shell /bin/false node_exporter
Next, download the node exporter binary file.
$ wget https://github.com/prometheus/node_exporter/releases/download/v1.9.0/node_exporter-1.9.0.linux-amd64.tar.gz
Unzip the downloaded binary file using the following command.
$ tar -xvzf node_exporter-1.9.0.linux-amd64.tar.gz
Rename the extracted directory to node_exporter.
$ mv node_exporter-1.9.0.linux-amd64 node_exporter
Go to the node_exporter directory and copy the executable file to /usr/local/bin directory.
$ cd node_exporter
$ sudo cp node_exporter /usr/local/bin/
Change the ownership of the binary executable file.
$ sudo chown node_exporter:node_exporter /usr/local/bin/node_exporter
Create a service file for node exporter to run it is as a daemon and copy the following configuration there.
$ sudo nano /etc/systemd/system/node_exporter.service
[Unit]
Description=Node Exporter
[Service]
User=node_exporter
Group=node_exporter
Type=simple
ExecStart= /usr/local/bin/node_exporter
Restart=on-failure
RestartSec=5
[Install]
WantedBy=multi-user.target
Reload the daemon and start the node_exporter service.
$ sudo systemctl daemon-reload
$ sudo systemctl start node_exporter.service
$ sudo systemctl enable node_exporter.service
Please note: By default Webdock Perfect Server stacks allows traffic from specific ports. You need to open the ports explicitly whenever needed.
In case of a Webdock Perfect Server stack, open the port 9100 on the server.
$ sudo ufw allow 9100/tcp
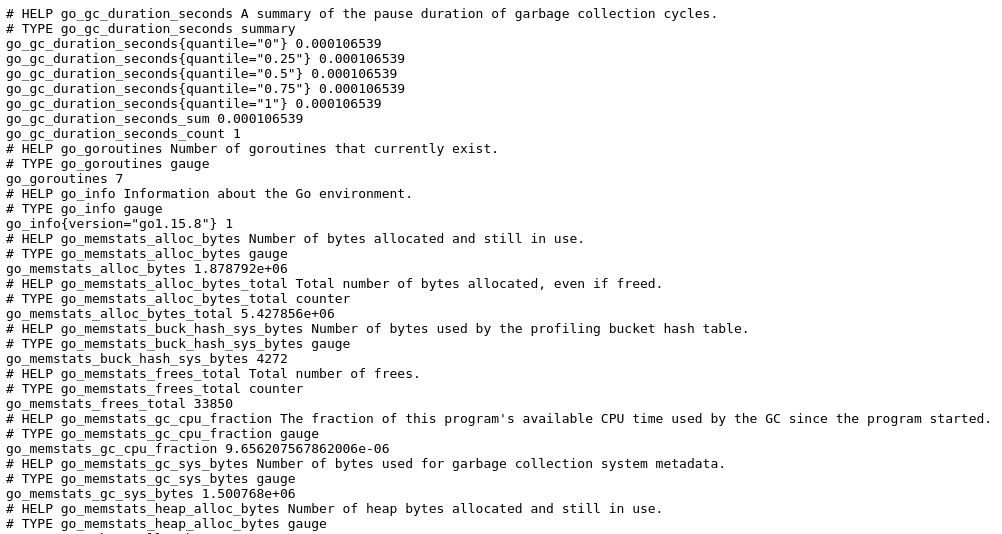
Now check the port 9100 of the server, it will list the system metrics in raw form.
Installing Prometheus
Create a prometheus user with no login permission and without home directory.
$ sudo adduser --no-create-home --disabled-login --shell /bin/false prometheus
Download the Prometheus binary file.
$ wget https://github.com/prometheus/prometheus/releases/download/v3.2.0/prometheus-3.2.0.linux-amd64.tar.gz
Unzip the downloaded binary file.
$ tar -xvzf prometheus-3.2.0.linux-amd64.tar.gz
Change the directory name to prometheus.
$ mv prometheus-3.2.0.linux-amd64 prometheus
Go to the prometheus directory.
$ cd prometheus
Create configuration and data directories for Prometheus.
$ sudo mkdir -p /etc/prometheus/{rules,rules.d,files_sd} /var/lib/prometheus
Copy the binary files to the /usr/local/bin directory.
$ sudo cp prometheus promtool /usr/local/bin
Copy the configuration file to the /etc/prometheus directory.
$ sudo cp prometheus.yml /etc/prometheus/
Change the ownership of the files and directories.
$ sudo chown -R prometheus:prometheus /etc/prometheus/ /var/lib/prometheus /usr/local/bin/{promtool,prometheus}
Create a service file to allow Prometheus to run in the background
$ sudo nano /etc/systemd/system/prometheus.service
[Unit]
Description=Prometheus
[Service]
User=prometheus
Group=prometheus
Type=simple
ExecStart= /usr/local/bin/prometheus
--config.file=/etc/prometheus/prometheus.yml
--storage.tsdb.path=/var/lib/prometheus
--web.console.templates=/etc/prometheus/consoles
--web.console.libraries=/etc/prometheus/console_libraries
--web.listen-address=0.0.0.0:9090
Restart=on-failure
RestartSec=5
[Install]
WantedBy=multi-user.target
Reload the daemon and start the service.
$ sudo systemctl daemon-reload
$ sudo systemctl start prometheus.service
$ sudo systemctl enable prometheus.service
In case of Webdock Perfect Server stack, open the port 9090.
$ sudo ufw allow 9090/tcp
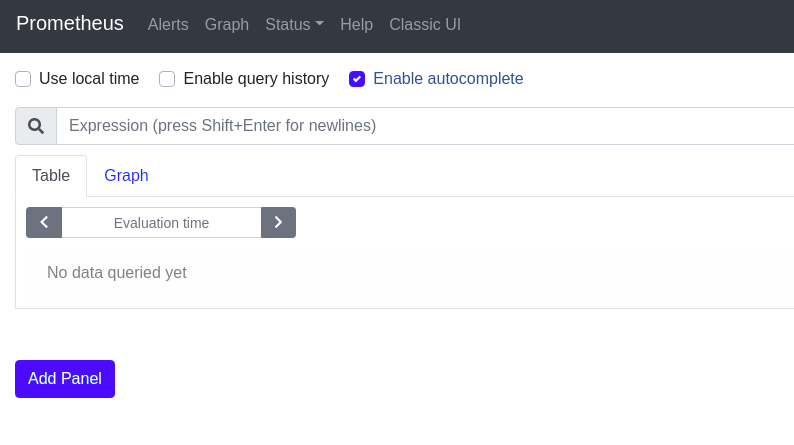
Visit port 9090 of the server in a browser (e.g. http://mysite.com:9090) and it will show the following web page.
Installing Grafana
Update the system.
$ sudo apt-get update -y
Add gpg key for Grafana.
$ sudo apt-get install gnupg2 curl -y
$ curl https://packages.grafana.com/gpg.key | sudo apt-key add -
Add apt-repository for Grafana.
$ sudo add-apt-repository "deb https://packages.grafana.com/oss/deb stable main"
Update the apt-repositories on ubuntu.
$ sudo apt-get update -y
Install Grafana using the following command.
$ sudo apt-get install grafana -y
Reload the daemon and start the Grafana server.
$ sudo systemctl daemon-reload
$ sudo systemctl start grafana-server.service
$ sudo systemctl enable grafana-server.service
In case of a Webdock Perfect Server stack, open the port 3000.
$ sudo ufw allow 3000/tcp
Visit port 3000 of the server in a browser (e.g. http://mysite.com:3000) of the server and it will display a login page.

Adding Targets to Prometheus
Open the prometheus.yml file.
$ sudo nano /etc/prometheus/prometheus.yml
Add the following configuration in the file (it should look similar). It is safe to remove any default config and replace it with the below one.
global:
  scrape_interval: 15s
  evaluation_interval: 15s

scrape_configs:
  - job_name: 'System Resources'
    scrape_interval: 10s
    static_configs:
      - targets: ['localhost:9100']

  - job_name: 'Prometheus'
    scrape_interval: 10s
    static_configs:
      - targets: ['localhost:9090']
Restart the prometheus service.
$ sudo systemctl restart prometheus
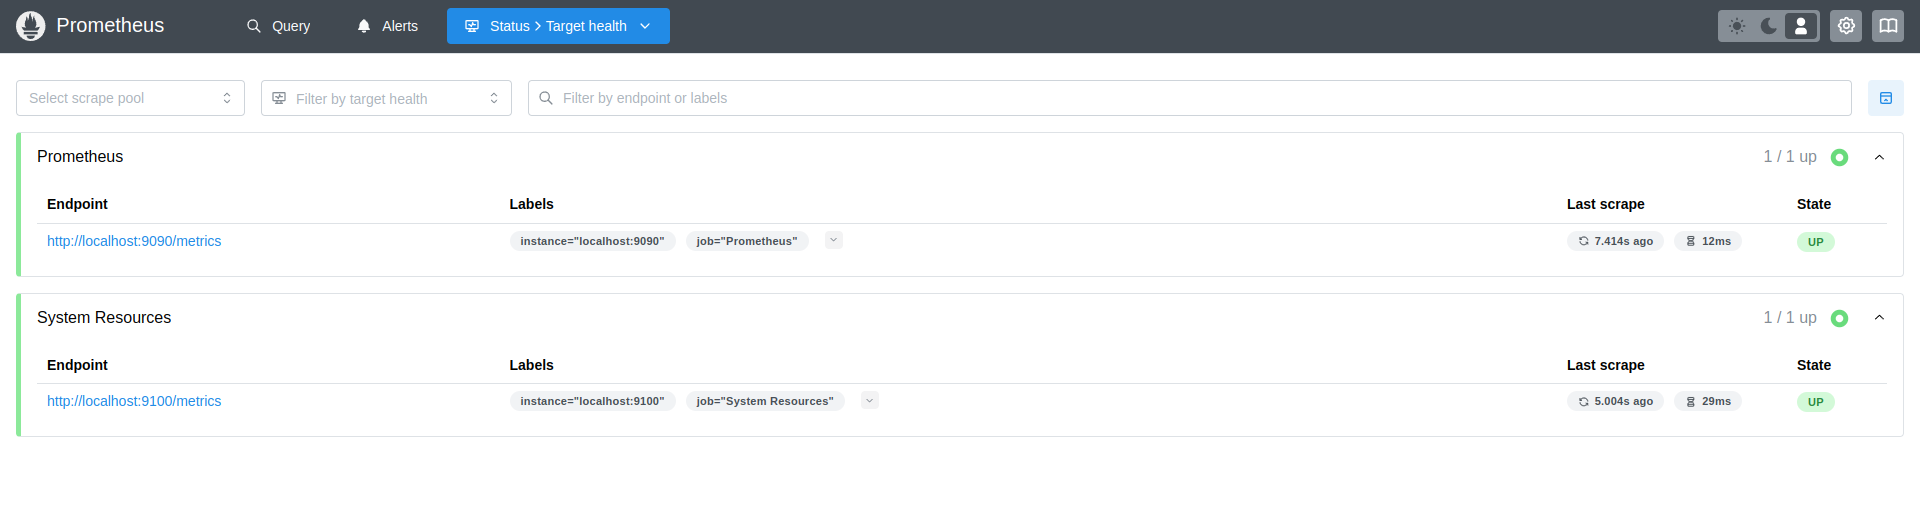
Visit port 9090 of the server in a browser (e.g. http://mysite.com:9090 and list all the targets.
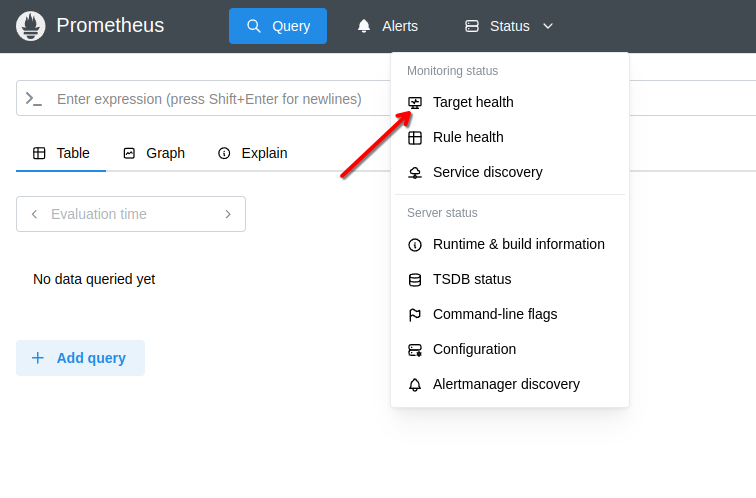
It will show all the targets defined in the prometheus.yml file there.
Adding Data Source and Dashboard to Grafana
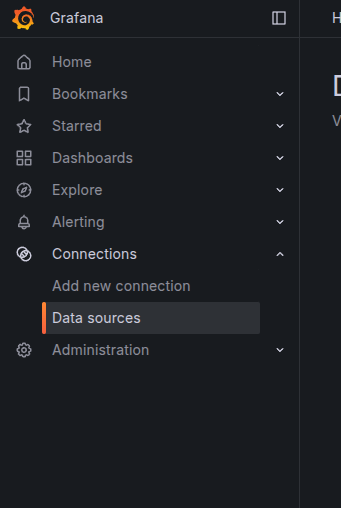
Log into the Grafana Dashboard using the default username and password (i.e admin). Hover over the Connections tab on the left side menu and then click on ‘Data Sources’.
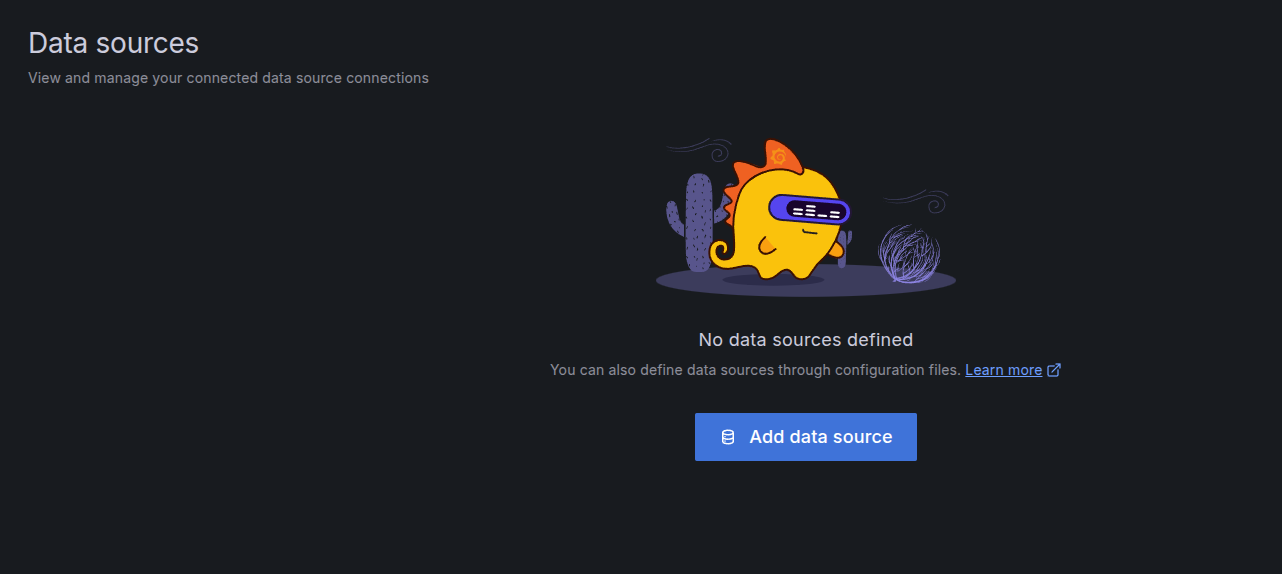
It will open a configuration page. Select the ‘Data Sources’ tab and click on ‘Add data source’.
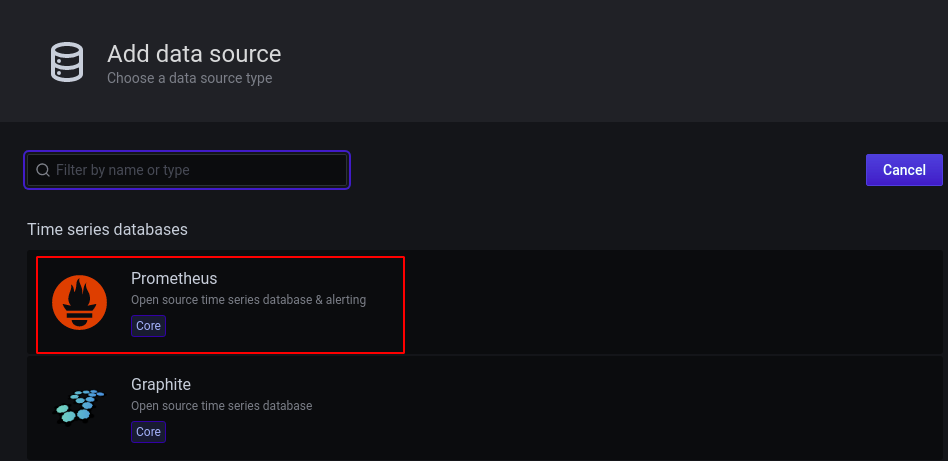
On the ‘Add data source’ page select the Prometheus as data source.
Provide the name and the url of the Prometheus data source.
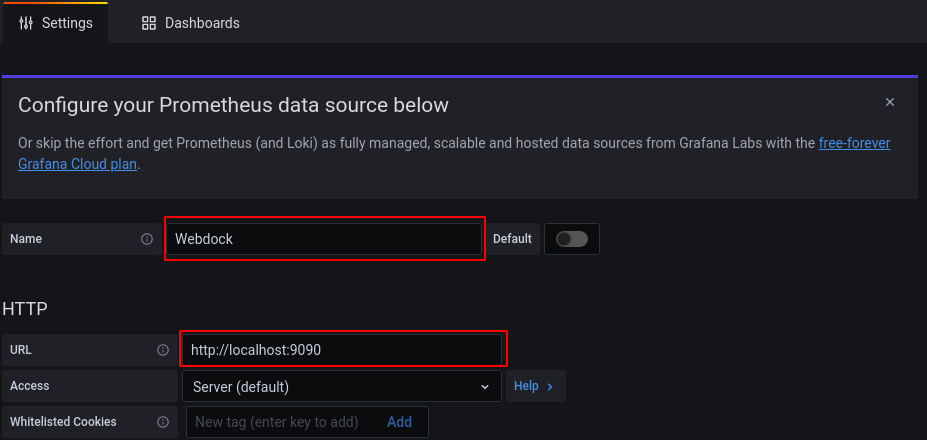
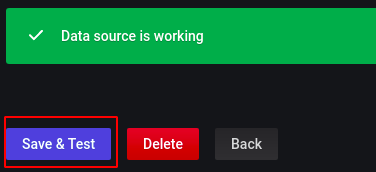
Click on the ‘save & test’ button at the end of the page and it will show the status of the Data Source.
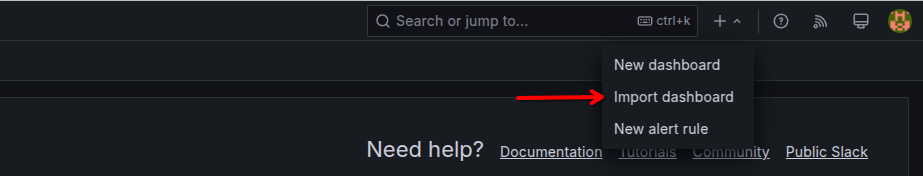
In order to import Grafana dashboard, hover over the ‘Add’ symbol and click on ‘import dashboard’.
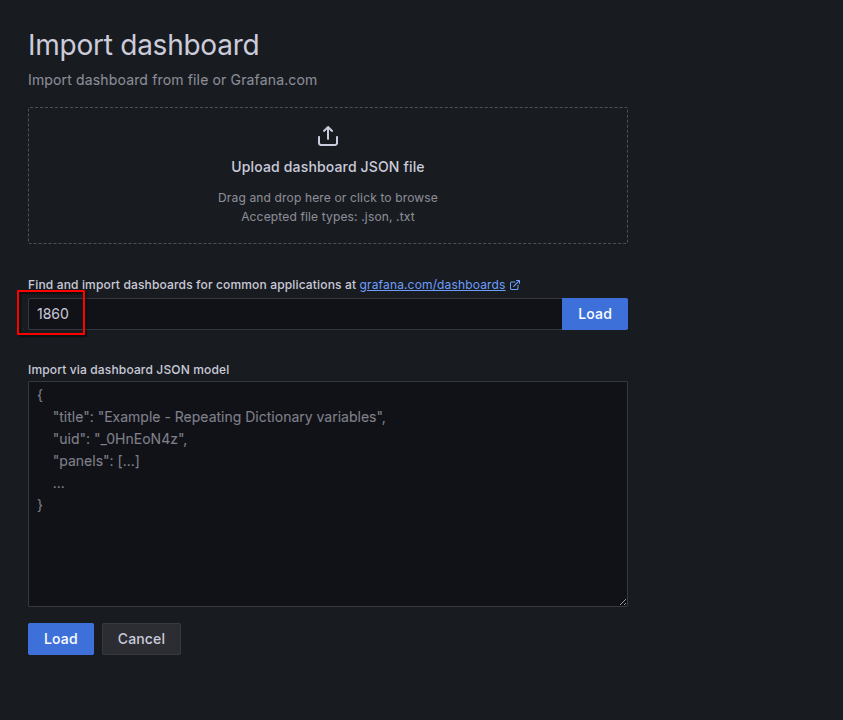
Enter the Grafana dashboard id and click on ‘load’.
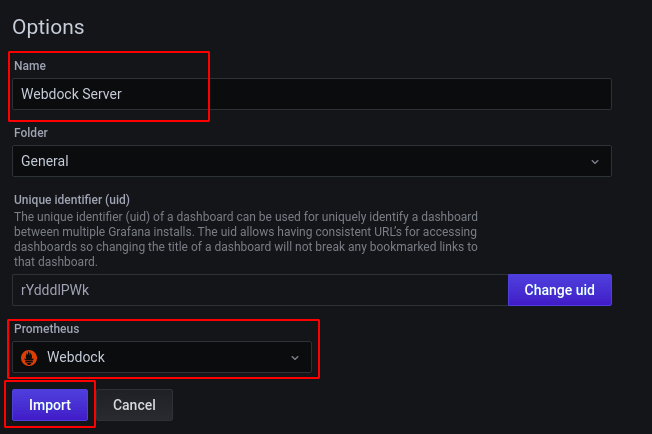
After loading the dashboard, it will ask for the dashboard name and the Prometheus data source. Click on import after providing the required details.
Monitoring System Resources using Grafana
After importing the dashboard, it will display a monitoring dashboard. Click on the time range selector on the top right corner of the dashboard and select a time range.
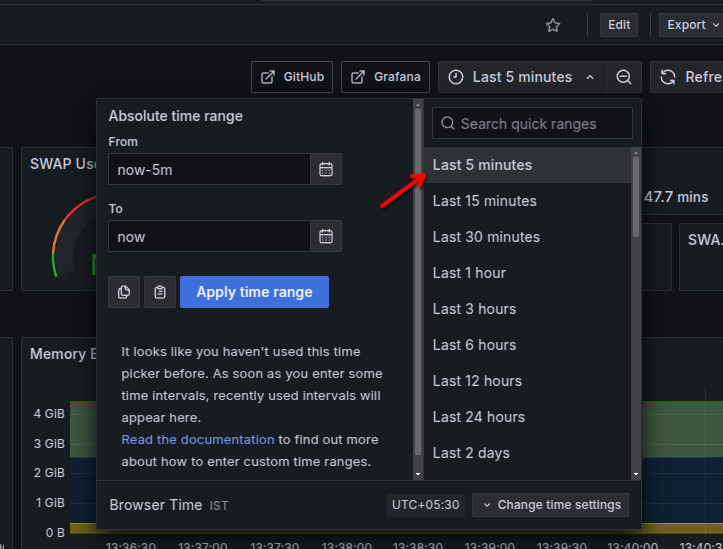
The dashboard will display all the system metrics for the selected time range.

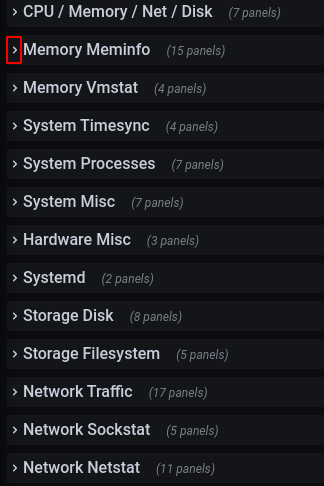
Scroll down the dashboard and it will show a lot more metrics there. Just click on the expand button and it will show the selected system metrics in graphical form.
Installing Prometheus Alert Manager
Create an alert_manager user without home directory and no login permissions.
$ sudo adduser --no-create-home --disabled-login --shell /bin/false alert_manager
Download the alert manager binary file.
$ wget https://github.com/prometheus/alertmanager/releases/download/v0.28.0/alertmanager-0.28.0.linux-amd64.tar.gz
Unzip the downloaded binary file.
$ tar -xvzf alertmanager-0.28.0.linux-amd64.tar.gz
Rename the extracted directory.
$ mv alertmanager-0.28.0.linux-amd64 alertmanager
Go to the alertmanager directory.
$ cd alertmanager
Create a data directory for alertmanager.
$ sudo mkdir /var/lib/alertmanager
Copy the amtool and alertmanager executable files to /usr/local/bin directory.
$ sudo cp amtool alertmanager /usr/local/bin/
Copy the alertmanager.yml file to the /etc/prometheus/ directory.
$ sudo cp alertmanager.yml /etc/prometheus/
Change the ownership of the executable files and data directory.
$ sudo chown -R alert_manager:alert_manager /usr/local/bin/{amtool,alertmanager} /var/lib/alertmanager
Create a service file to run the alertmanager in the background.
$ sudo nano /etc/systemd/system/alertmanager.service
[Unit]
Description=Alert Manager
[Service]
User=alert_manager
Group=alert_manager
Type=simple
ExecStart= /usr/local/bin/alertmanager
--config.file=/etc/prometheus/alertmanager.yml
--storage.path=/var/lib/alertmanager/
--cluster.listen-address=127.0.0.1:9094
Restart=on-failure
RestartSec=5
[Install]
WantedBy=multi-user.target
Reload the daemon and start the service.
$ sudo systemctl daemon-reload
$ sudo systemctl start alertmanager.service
$ sudo systemctl enable alertmanager.service
In case of a Webdock Perfect Server stack, open port 9094 and 9093.
$ sudo ufw allow 9094/tcp
$ sudo ufw allow 9093/tcp
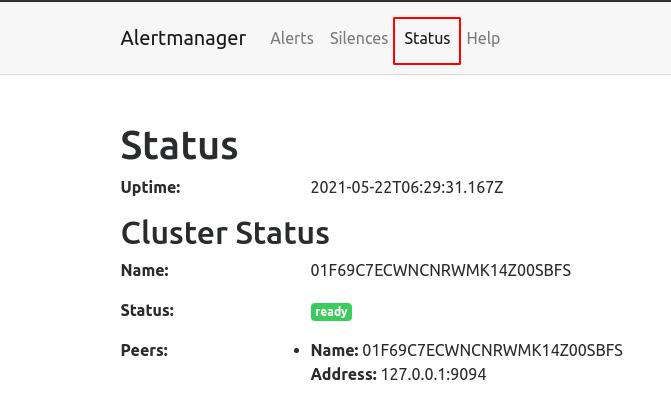
Visit port 9093 of the server in a browser (e.g. http://mysite.com:9093) and check the alert manager cluster status.
Configuring Alert Manager
Open the prometheus.yml file and append the following configuration.
$ sudo nano /etc/prometheus/prometheus.yml
alerting:
  alertmanagers:
  - static_configs:
    - targets:
      - 'localhost:9093'
rule_files:
  - "rules.yml"
Create a file named ‘rules.yml’ at /etc/prometheus directory and add the alert rules there.
$ sudo nano /etc/prometheus/rules.yml
groups:
- name: alert.rules
  rules:
  - alert: InstanceDown
    expr: up == 0
    for: 1m
    labels:
      severity: "critical"
    annotations:
      summary: "Endpoint {{ $labels.instance }} down"
      description: "{{ $labels.instance }} of job {{ $labels.job }} has been down for more than 1 minutes."
  - alert: HostOutOfMemory
    expr: node_memory_MemAvailable_bytes / node_memory_MemTotal_bytes * 100 < 25
    for: 5m
    labels:
      severity: warning
    annotations:
      summary: "Host out of memory (instance {{ $labels.instance }})"
      description: "Node memory is filling up (< 25% left)n VALUE = {{ $value }}n LABELS: {{ $labels }}"
  - alert: HostOutOfDiskSpace
    expr: (node_filesystem_avail_bytes{mountpoint="/"} * 100) / node_filesystem_size_bytes{mountpoint="/"} < 50
    for: 10s
    labels:
      severity: warning
    annotations:
      summary: "Host out of disk space (instance {{ $labels.instance }})"
      description: "Disk is almost full (< 50% left)n VALUE = {{ $value }}n LABELS: {{ $labels }}"
  - alert: HostHighCpuLoad
    expr: (sum by (instance) (irate(node_cpu_seconds_total{job="System Resources",mode="idle"}[5m]))) > 80
    for: 5m
    labels:
      severity: warning
    annotations:
      summary: "Host high CPU load (instance {{ $labels.instance }})"
      description: "CPU load is > 80%n VALUE = {{ $value }}n LABELS: {{ $labels }}"
Restart the Prometheus service to apply these changes.
$ sudo systemctl restart prometheus.service
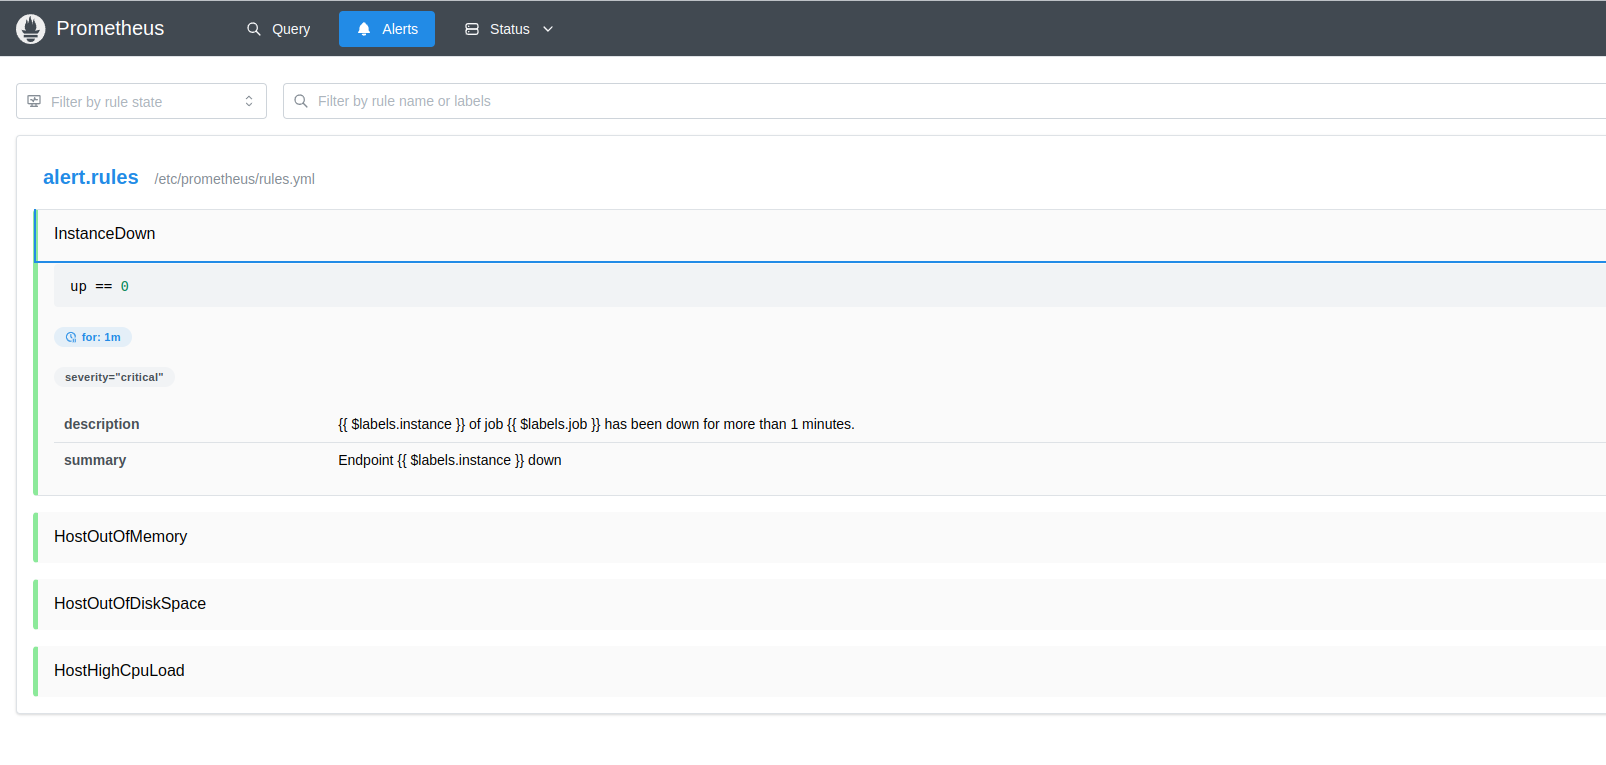
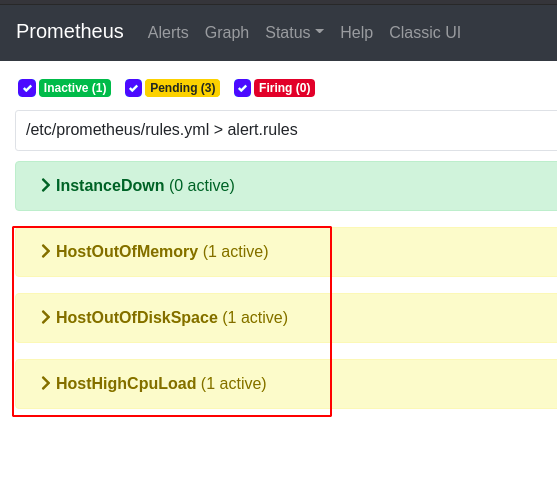
Visit port 9090 of the server in a browser (e.g. http://mysite.com:9090 and click on the ‘Alert’ button and it will show all the alerts configured in the ‘rules.yml’ file.
Configuring Email Notification
Open the alertmanager.yml file and add the email configuration (or replace existing config with this one, depends on your setup)
$ sudo nano /etc/prometheus/alertmanager.yml
global:
  resolve_timeout: 1m
route:
  group_by: ['alertname']
  group_wait: 10s
  group_interval: 10s
  repeat_interval: 1h
  receiver: 'email_notification'
receivers:
- name: 'email_notification'
  email_configs:
  - to : "to"
    from: "from"
    smarthost: smtp.gmail.com:587
    auth_username: "email"
    auth_identity: "email"
    auth_password: "password"
    send_resolved: true
inhibit_rules:
  - source_match:
      severity: 'critical'
    target_match:
      severity: 'warning'
    equal: ['alertname', 'dev', 'instance']
Restart the alert manager and prometheus services.
$ sudo systemctl restart prometheus.service
$ sudo systemctl restart alertmanager.service
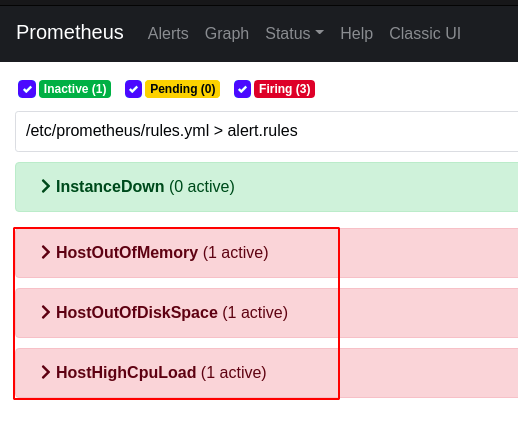
Now whenever system resources cross a specific threshold defined in rules.yml file, the status of alerts will change from ‘inactive’ to ‘pending’.
And after some time, the status will be in ‘Firing’ state and an email notification will be sent.
Conclusion
Node exporter, Prometheus and Grafana work together to display all the system metrics on a single dashboard. Prometheus alert manager is a tool used to alert when a specific system metric crosses a threshold specified in rules.yml file.
