Introduction
Netstat is a versatile Linux tool that monitors your network connections. Think of it as a window into your system’s activities.
With this command, you can see which applications are talking to the internet, what ports are open, and even how data flows in and out.
Why might you need this? If you’re dealing with connection issues or just want to understand your network better, Netstat gives you the insights you need. You might notice unusual activity or find out if a service is listening for incoming connections, which could help you spot potential security risks.
Knowing how to interpret the output allows you to troubleshoot issues effectively and maintain your system’s security.
In short, having Netstat in your toolkit empowers you to manage your Linux environment confidently and effectively. It’s not just a command; it’s a way to keep your network healthy and secure.
If you need an affordable and reliable server for these management tasks, you can buy cheap Linux VPS hosting from Webdock.
So, let’s take a deep dive and understand how you can use Netstat. I will also share some helpful Netstat commands that might come in handy for managing your server. Let’s go!
Using Netstat
Netstat is usually installed on most Linux flavors, but if you’re unsure, you can try installing the net-tools package. For Ubuntu, the command would be:
$ sudo apt install net-tools
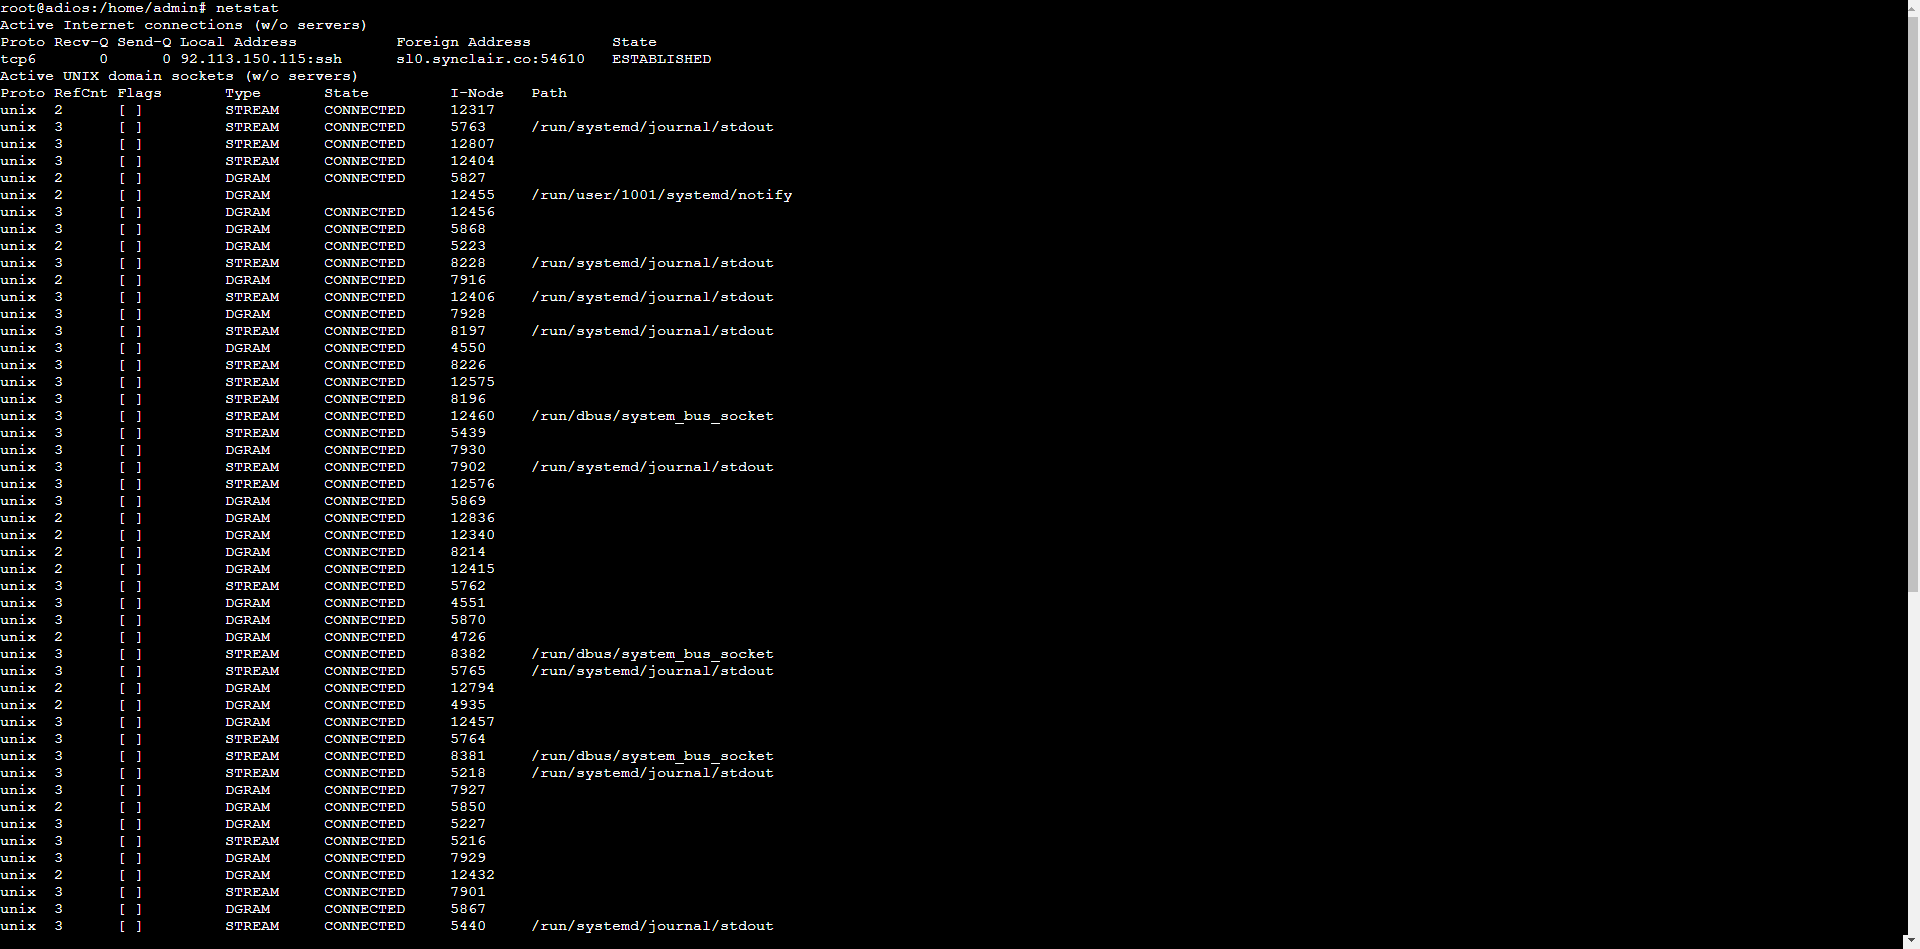
Running netstat without any specific command line options reveals a detailed overview of all active sockets and network connections on your system:
$ netstat
The output is organized into two tables, providing a structured view of the information. The list is quite extensive, showcasing every connection currently in use.
Reading The Results
In the first table, you’ll find information about network connections, explained as follows:
- Protocol: Identifies the communication framework currently employed, which may be TCP, UDP, or raw protocol.
- Receive Queue (Recv-Q): Measures unprocessed data volume for TCP sessions – specifically bytes that have arrived at your device but remain unhandled by the requesting application.
- Send Queue (Send-Q): Tracks outbound data packets that have departed your system but lack confirmation of successful delivery from the recipient.
- Local Address: Shows your device’s connection endpoint, displaying both address and port information. When resolution is possible, this field presents recognizable hostnames and service identifiers (for example, showing SSH instead of numerical port 22).
- Foreign Address: Reveals the remote connection participant’s location and port details. Similar to local addressing, this field attempts to display meaningful names rather than raw numerical values when such information is available.
- State: Indicates the connection’s operational phase. This field typically remains empty for raw protocol and UDP connections. For TCP connections, it displays various status indicators like SYN_RECV, SYN_SENT, or ESTABLISHED. By default, many displays exclude connections in the LISTEN state.
The second table focuses on Unix sockets, with column descriptions as follows:
- Protocol: Signifies which communication standard this socket implements, with Unix being the framework identified here.
- Reference Count (RefCnt): Tallies the total number of processes currently maintaining active links through this particular socket.
- Flags: Contains operational markers for this socket. The common ACC notation (abbreviating SO_ACCEPTON) indicates a socket in passive mode awaiting incoming connection requests.
- Type: Specifies the socket’s architectural category – options include two-way communication channels (SOCK_STREAM), message-based exchanges (SOCK_DGRAM), direct protocol access (SOCK_RAW), guaranteed message delivery systems (SOCK_RDM), ordered packet services (SOCK_SEQPACKET), or the deprecated SOCK_PACKET.
- State: Reflects the socket’s current operational phase. Possible values include FREE (unallocated), LISTENING (awaiting connections), CONNECTING (establishing a connection), CONNECTED (active session), or DISCONNECTING (terminating). Empty state fields indicate no existing connection. Standard output typically excludes LISTENING sockets.
- I-Node: Provides the unique filesystem indexing number assigned to this socket.
- Path: Displays the complete filesystem address where this socket exists
Customizing Your Netsat Results
By using various command-line options and flags, you can filter and format the information displayed, making it easier to focus on the data that matters most for your network management tasks.
Here are many important and frequently used flags options for netstat:
- -4: Filters results to show only IPv4 connections, hiding any IPv6 traffic.
- -6: Restricts output exclusively to IPv6 connections, omitting IPv4 data.
- -A: Controls protocol selection by family type; acceptable values include inet, inet6, unix, ipx, ax25, netrom, econet, ddp, and bluetooth.
- -a: Expands visibility to encompass all connections—both active and passive—plus Unix socket information.
- -c: Activates dynamic monitoring with automatic refresh occurring at one-second intervals.
- -C: Pulls and displays pathway information stored in the system’s route cache.
- -e: Toggles enhanced view mode with additional connection metadata.
- -g: Reveals group membership data for multicast communications across both IPv4 and IPv6 protocols.
- -i: Generates a comprehensive interface listing; pair with -a to include inactive network interfaces.
- -l: Narrows focus to only listening ports and sockets, which standard views typically exclude.
- -n: Forces numerical IP address display instead of performing hostname resolution.
- -o: Incorporates timing information for each listed connection.
- -p: Reveals ownership details showing which program controls each socket via process ID and name; requires root access.
- -r: Extracts and presents the system’s internal routing tables.
- -t: Creates a TCP-specific view by filtering out other protocols.
- -u: Produces a UDP-focused display by removing non-UDP connections.
- -v: Switches to detailed output mode with comprehensive information.
- -W: Prevents address truncation, ensuring complete visibility of IP addresses regardless of display constraints.
Some Helpful Netstat Commands
In this section, you’ll explore a selection of helpful netstat commands that can enhance your network management skills. I have skipped the obvious ones, which you can use by just using the flags above.
Note: Some commands may need to be run as root. In that case run “sudo su” before running the netstat command.
Display All TCP and UDP Connections with Process Information
$ netstat -tupc
This command shows all active TCP and UDP connections along with the process information. Useful for identifying which applications are using network resources.
Show Only IPv6 Connections with Numeric Addresses
$ netstat -6n
This command displays only IPv6 connections without resolving hostnames. Helpful for troubleshooting IPv6-specific network issues in environments using dual-stack networking.
View All Listening Unix Domain Sockets
$ netstat -lx
This command lists all Unix domain sockets that are in listening state. Essential for diagnosing inter-process communication issues on local systems.
Display Multicast Group Memberships
$ netstat -g
Use this command to view all multicast group memberships for both IPv4 and IPv6. Important for troubleshooting multicast applications and services.
Show Packet Statistics for Each Protocol
$ netstat -s
This command provides detailed packet statistics organized by protocol. Useful for performance analysis and identifying protocol-specific issues.
List All Raw Sockets
$ netstat -raw
Lists all raw sockets in use. Important for security analysis and identifying applications using low-level network access.
Display Unix Socket Path Names
$ netstat -xl
Shows Unix socket connections with their full path names, making it easier to identify which socket files applications are using.
Count Connections by State
$ netstat -ant | awk '{print $6}' | sort | uniq -c
Provides a count of connections grouped by their state. Helpful for getting a quick overview of connection health.
Show Active Internet Connections
$ netstat -tup
Displays active Internet connections with their associated processes. Useful for focusing on established connections.
View TCP Connections with Process Names
$ netstat -tp
Shows TCP connections with their associated process names, helping identify which applications are using the network.
Show Listening Ports for Specific Program
$ netstat -tlp | grep apache2
Replace “apache2” with any program name to filter listening ports for a specific application. Useful for verifying service availability.
Display Kernel Interface Table with Extended Information
$ netstat -ie
Shows network interface information with extended details, providing more comprehensive information than the basic interface list.
List All Connections to a Specific Destination Port
$ netstat -ant | grep ":443 "
Filters connections to show only those connecting to port 443 (HTTPS). Replace with any port number to monitor specific services.
Show Connection Statistics with No Name Resolution
$ netstat -s --numeric
Displays protocol statistics without resolving hostnames or port numbers, making output faster and more readable for large networks.
Display All Listening TCP Ports with Numeric Addresses
$ netstat -lnt
Shows listening TCP ports with numeric addresses, useful for quick security audits and service verification.
View UDP Listening Ports with Process Information
$ netstat -lup
Lists all UDP ports in listening state along with their associated processes, helping identify which services are using UDP.
Count Connections by Remote Address
$ netstat -an | awk '{print $5}' | grep -v ":::" | sort | uniq -c
Counts connections grouped by remote IP address, helping identify potential DDoS sources or connection-heavy clients.
Show Memory Statistics for Network
$ netstat -m
Shows memory statistics related to network operations, helping diagnose memory usage issues in network subsystems.
List All TCP States Except ESTABLISHED
$ netstat -t | grep -v ESTAB
Shows all TCP connections that are not in the ESTABLISHED state, helping identify problematic connections.
Show Listening Ports Below 1024 (Privileged)
$ netstat -lnt | grep ":[0-9]{1,3}[ t]"
Lists listening ports in the privileged range (below 1024), useful for security audits.
View Network Statistics Continuously
$ netstat -i -c
Displays interface statistics continuously, allowing real-time monitoring of traffic patterns.
Show All Listening Ports with Service Names
$ netstat -atl
Lists all listening TCP ports with service names, providing a comprehensive view of available services.
Count Connections by Local Port
$ netstat -ant | awk '{print $4}' | grep ":[0-9]" | cut -d: -f2 | sort | uniq -c
Counts connections grouped by local port, helping identify which services are handling the most connections.
View Only Internal TCP Connections
$ netstat -t | grep "127.0.0"
Lists TCP connections to and from localhost, helping diagnose inter-process communication issues.
Show Connections with Zero Receive Queue
$ netstat -ant | grep "0 0"
Identifies connections with empty receive queues, potentially indicating idle or stalled connections.
Display Only FIN_WAIT States
$ netstat -ant | grep FIN_WAIT
Shows connections in FIN_WAIT states, helping identify connections that might be improperly closed.
View Processes Listening on Unix Sockets
$ netstat -lxp
Lists processes listening on Unix domain sockets, useful for diagnosing IPC issues.
Show Connections by Specific User’s Processes
$ netstat -tp | grep -v root
Shows TCP connections from processes not owned by root, helping identify user-level network activity.
Display Routing Table with Extended Information
$ netstat -rne
Shows the routing table with extended information and numeric addresses, providing more detail for complex routing scenarios.
Count TCP Connections by Remote Port
$ netstat -tn | awk '{print $5}' | grep ":[0-9]" | cut -d: -f2 | sort | uniq -c
Counts TCP connections grouped by remote port, helping identify which services your system is connecting to most frequently.
Show Connections with Non-Zero Receive Queue
$ netstat -ant | awk '$3 > 0 {print $0}'
Identifies connections with data in the receive queue, potentially indicating processing bottlenecks.
View Statistics for ICMP Protocol Only
$ netstat -s | grep -A 20 "Icmp:"
Shows detailed statistics for the ICMP protocol, useful for diagnosing network reachability issues.
Display Only TIME_WAIT Connections
$ netstat -ant | grep TIME_WAIT
Shows connections in TIME_WAIT state, helping diagnose socket reuse issues.
List Interfaces with Error Counts
$ netstat -i | awk '$4 > 0 || $8 > 0 {print $0}'
Shows network interfaces that have recorded errors, helping identify problematic hardware or configurations.
View Active Connections with Process Command Line
$ netstat -tnp
Displays active TCP connections with the full command line of associated processes, providing context for network activities.
Show Only Connections in SYN_RECV State
$ netstat -ant | grep SYN_RECV
Lists TCP connections in the SYN_RECV state, which can help identify potential SYN flood attacks.
Display Statistics for IP Forwarding
$ netstat -s | grep -A 10 "Ip:"
Shows IP forwarding statistics, useful for systems configured as routers or firewalls.
View UDP Statistics Only
$ netstat -su
Displays detailed statistics for UDP traffic, helping diagnose UDP-specific issues.
Show Connections on Non-Standard Ports
$ netstat -ant | grep -v -E ":(22|80|443|25|53) "
Lists connections to ports other than common ones, useful for identifying unusual network activity.
Show All Established Connections Without Listening
$ netstat -at | grep ESTAB
Shows only established TCP connections, filtering out other connection states for a clearer view of active sessions.
Display IPv4 Statistics Only
$ netstat -s4
Shows statistics for IPv4 protocols only, useful for IPv4-specific troubleshooting.
View Kernel Routing Information
$ netstat -r --numeric
Displays the kernel routing table with numeric addresses, avoiding DNS lookups for faster output.
Show Listening TCP/UDP Ports with Process Info
$ netstat -tulpn
Displays listening TCP and UDP ports with numeric addresses and process information, providing a comprehensive view for security audits.
Display All UDP Connections
$ netstat -ua
Shows all UDP connections, including those without an established state, helping identify UDP-based services.
Count Established Connections per Remote IP
$ netstat -ant | grep ESTAB | awk '{print $5}' | cut -d: -f1 | sort | uniq -c
Counts established connections grouped by remote IP, helping identify client connection distribution.
Show UNIX Sockets with Process Information
$ netstat -xp
Displays all Unix domain sockets with their associated processes, useful for diagnosing local IPC.
List All Ports in Use
$ netstat -atn | awk '{print $4}' | cut -d: -f2 | grep -v "^$" | sort -n | uniq
Shows a unique sorted list of all ports currently in use, helpful for identifying port utilization.
Display IPv6 TCP Connections Only
$ netstat -6t
Shows only IPv6 TCP connections, useful for IPv6-specific troubleshooting.
View All Connection States for a Specific Port
$ netstat -ant | grep ":80 "
Displays all connection states for port 80 (HTTP), useful for web server diagnostics. Can be modified for any port.
Show All Established Connections with Send-Q > 0
$ netstat -ant | grep ESTAB | awk '$2 > 0 {print $0}'
Lists established connections with data in the send queue, potentially indicating network congestion or slow receivers.
In Conclusion
As I reflect on our discussion about netstat, I see its lasting value in managing networks, even though some might consider it outdated.
While newer tools are available, I value netstat for its simplicity. It delivers essential information without unnecessary complications, making it accessible for beginners and experienced users alike. Its straightforward layout allows anyone to evaluate their systems quickly, making it a practical resource for troubleshooting.
So, when I encounter networking challenges, I remember that this classic command can help me manage my Linux environment effectively.
Meet Aayush , a WordPress website designer with almost a decade of experience who crafts visually appealing websites and has a knack for writing engaging technology blogs. In his spare time, he enjoys illuminating the minds around him.
