Introduction
In my previous blog post, I demonstrated how to set up PHP with FastCGI in NGINX as part of my ongoing series on “Introduction to Web Server Setup & Management.” This series aims to understand web servers and their interactions with users comprehensively. By the end, you’ll have the skills to optimize your web server for an exceptional user experience. What sets this series apart is that it goes beyond specific programming languages and environments. The knowledge gained here can be applied across various platforms, making it a valuable addition to your skill set. Furthermore, through this series, you’ll understand why Webdock has developed its services the way it has.
And, In this segment, let’s take an in-depth look at NGINX logs. Logs offer valuable insight into the activities on your server and are essential for managing your Nginx hosting effectively. We’ll discover why leveraging these logs is beneficial and how they can spare you plenty of headaches when dealing with problems later on. Furthermore, we’ll dive into various NGINX log files while sharing a handy setup trick.
Whether you are a beginner, an experienced system administrator, or an IT manager, understanding NGINX logs is crucial for resolving issues. Let’s dive into this topic!
What are NGINX logs?
NGINX logs consist of a collection of records created by the NGINX web server. These records offer valuable insight into the activities and engagements between the server and its clients, usually web browsers or other types of web clients. Monitoring and resolving performance, security, and behavior issues rely on these essential logs.
By consistently reviewing your NGINX logs, you can have the following advantages:
Troubleshooting
NGINX logs are a valuable source of information that offers detailed insights into requests, responses, and errors. In the event of an issue arising, administrators can rely on these logs to swiftly identify and troubleshoot problems like misconfigurations, server errors, or application issues.
Performance Monitoring
Access logs allow administrators to monitor server performance by tracking traffic patterns, request rates, and response times. This data can be utilized to optimize server resources, identify bottlenecks, and plan for scalability.
Security
NGINX logs play a crucial role in identifying and responding to security threats. Administrators can analyze access logs to detect suspicious activity, including frequent 404 errors, repeated login attempts, or unusual traffic patterns. This valuable information helps implement adequate security measures and safeguard the server from attacks.
User Behavior Analysis
Access logs provide information about user agents, referring URLs, and client IP addresses. This data is valuable for gaining insights into user behavior, tracking marketing campaigns, and optimizing website content.
Resource Usage
NGINX logs are essential for tracking resource usage, such as bandwidth consumption and the number of requests served. This valuable information enables efficient management of server resources and optimization of hosting costs.
Content Delivery
NGINX logs are handy for websites and applications that serve static content or function as reverse proxies. These logs offer valuable insights into how content is delivered and cached, which in turn helps optimize the delivery of content and reduce latency.
Compliance and Auditing
Many organizations are required to maintain logs for compliance and auditing purposes. NGINX logs document server activity, providing a historical record of what occurred on the server.
Real-Time Monitoring
Various tools and utilities can facilitate real-time monitoring of NGINX logs, enabling administrators to address issues as they arise promptly.
Alerting
By monitoring NGINX logs, administrators can establish alerting systems that notify them when specific events or error patterns are identified. This allows for swift response to critical issues.
How to configure NGINX logs?
To configure NGINX logs, you need to make changes to the NGINX configuration file to define what information should be logged and where the log files should be stored. Here is a simple guide on how to set up NGINX logs:
Configure Access Logs
Access the NGINX Configuration File
Usually, the main configuration file for NGINX is located at /etc/nginx/nginx.conf. However, you may also have separate configuration files for individual websites or applications in either /etc/nginx/conf.d/ or /etc/nginx/sites-available/. To change the appropriate configuration file, open it using a text editor with administrative privileges. For instance:
$ sudo nano /etc/nginx/nginx.conf
And then, to configure access logs, you will need to utilize the access_log directive. This directive should be positioned within either the http block or a specific server block, depending on whether you wish to set up access logs globally or for a particular website or location. For instance, if you want to enable access logging for all server blocks globally, simply insert the following line inside the http block:
access_log /var/log/nginx/access.log;
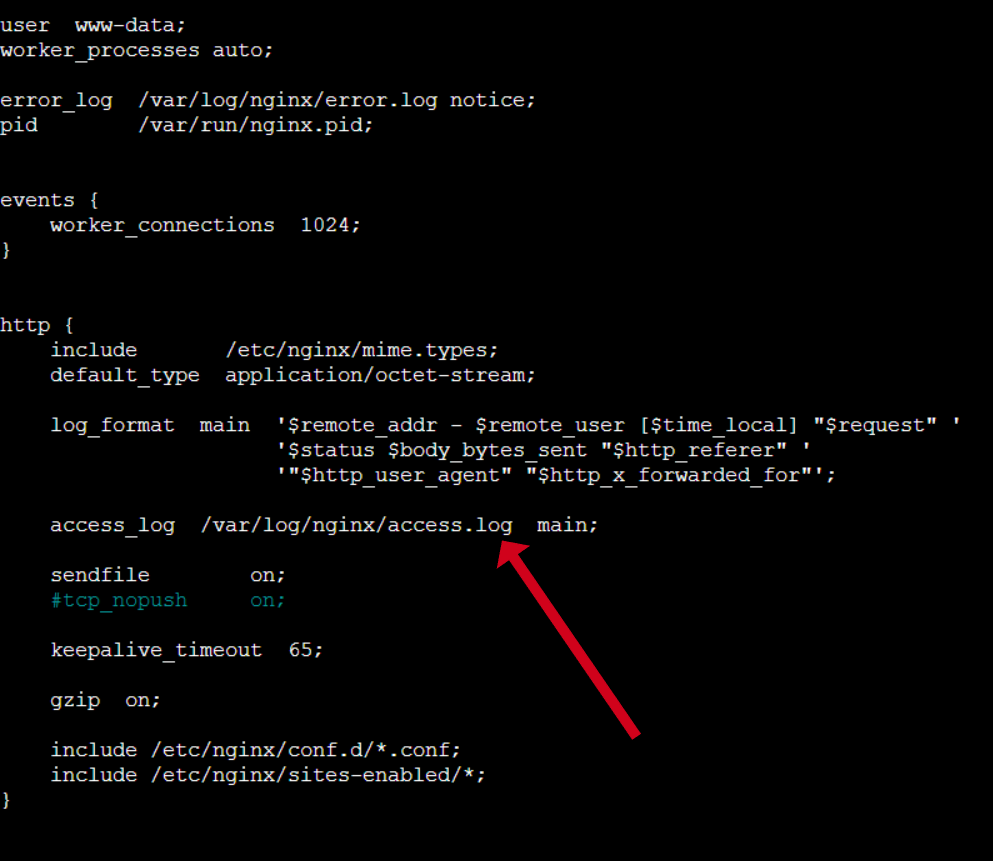
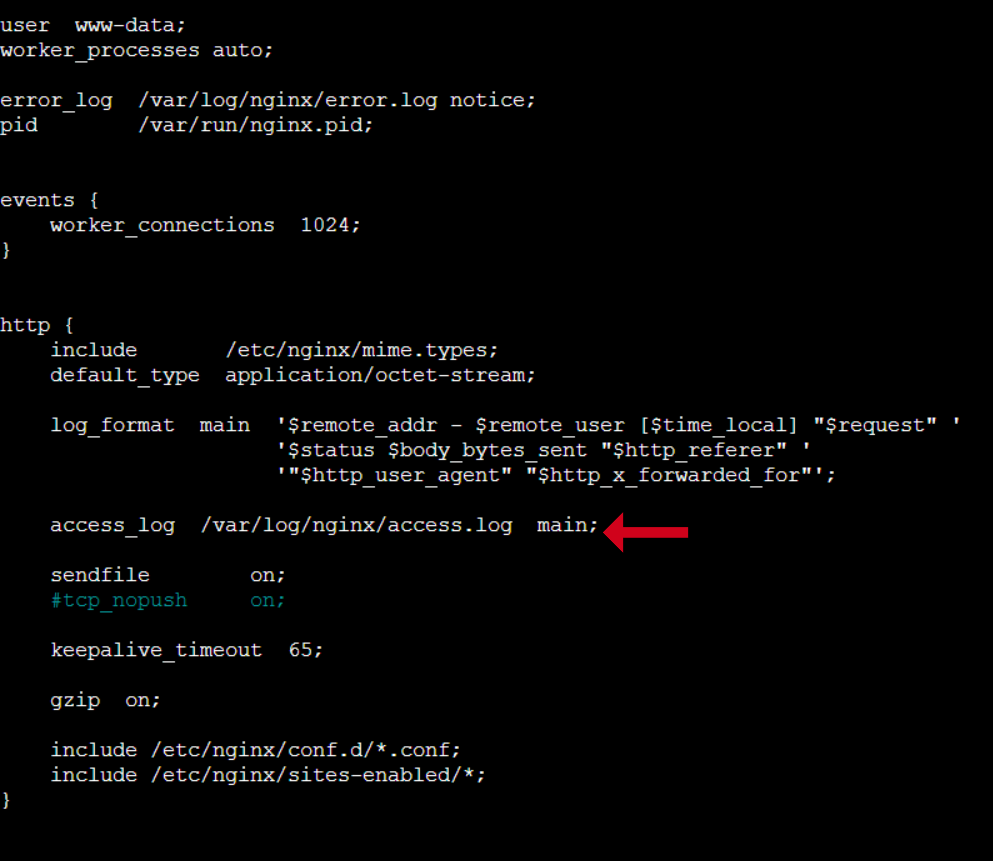
In this case, /var/log/nginx/access.log represents the file path for the access log. You can substitute it with your desired log file path. Additionally, you can define a specific log format using the log_format directive and then reference it in the access_log directive. This enables the customization of logged information. For instance, I have added “main”:
To save and exit the file in the nano text editor, press CTRL + X followed by the Y key.
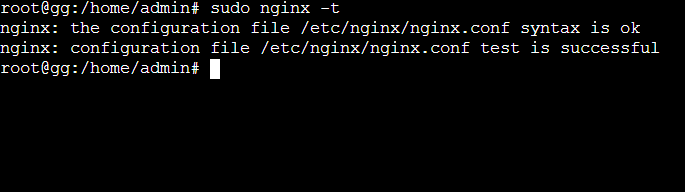
Before implementing the configuration changes, it is recommended to test the NGINX configuration for any syntax errors to prevent potential problems:
$ sudo nginx -t
If there are no syntax errors, a message will be displayed indicating that the configuration test has been successful.
To implement the configuration changes and begin logging, you need to restart the NGINX service:
$ sudo systemctl restart nginx
Configure Error Logs
Setting up the error log is very similar to configuring access logs. You can use the error_log directive to configure error logs, and it can be placed within either the http block or a specific server block:
error_log /var/log/nginx/error.log;
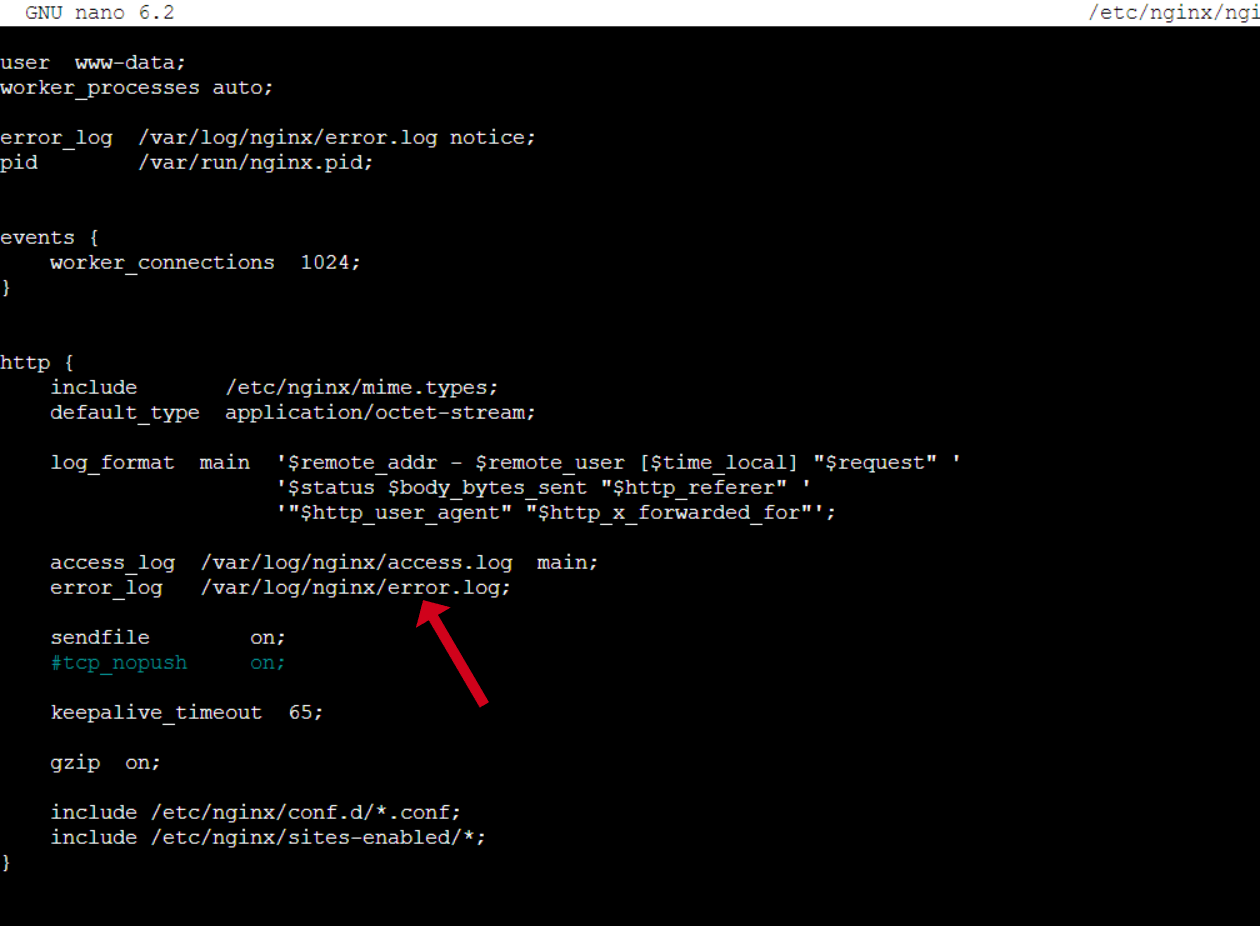
You can define a customized file path for your error log and adjust the level of error logging, just like you can do with access logs (e.g., specifying levels such as error, info, notice, warn, or crit).
Again, to avoid potential issues, testing the NGINX configuration for any syntax errors before implementing the configuration changes is advisable.
To apply the configuration changes and start logging, you should restart the NGINX service by using the command:
$ sudo systemctl restart nginx
Once the log files start writing, you can monitor them in real-time using tools like Tail or Cat. For example, to view the access log live:
$ sudo tail -f /var/log/nginx/access.log
With these instructions, you should have successfully set up NGINX logs to record access and error data. You can personalize the log format, file paths, and logging levels based on your specific needs.
Pro Tip: Set up Log Rotate
Logrotate is a tool that automates the management of log files by rotating, compressing, and removing them.
By utilizing Logrotate, system administrators can effectively handle log files, guaranteeing that log data is retained for auditing and troubleshooting purposes while preventing the accumulation of old logs from consuming disk space.
Logrotate configuration for NGINX logs is done by placing the configuration files in the /etc/logrotate.d/ directory. A sample configuration file already exists in that directory for Nginx at /etc/logrotate.d/nginx. You have two options: use this existing file as a template to create your custom configuration file or directly modify the example file according to your requirements. Here’s an example of what a logrotate configuration file for Nginx logs might look like:
/var/log/nginx/*.log {

 rotate 10

 daily

 compress

 delaycompress

 sharedscripts


 postrotate

 systemctl reload nginx > /dev/null

 endscript
}
The provided logrotate configuration file will rotate the Nginx logs daily and retain up to 10 days of log files. The rotated logs will be compressed to save disk space, and a new empty log file will be created after each rotation.
To save time, you can simply combine the process of opening the logrotate file using a text editor and adding the configuration by using the Cat command:
$ cat > /etc/logrotate.d/nginx << EOF

 /var/www/logs/*.log {

  rotate 10

  daily

  compress

  delaycompress

  sharedscripts

  postrotate

  systemctl reload nginx > /dev/null

  endscript

}

EOF
By default, Logrotate is typically scheduled to run once a day using a cron job. You can confirm this by executing the following command:
$ crontab -l
If you do not see the cron job set up, then you can add it to your crontab file using the following command:
$ crontab -e
This will open your crontab file in a text editor. Add the following line to the file:
0 0 * * * logrotate -f /etc/logrotate.conf
Once you save your changes and exit, logrotate will be scheduled to run at midnight every day by default. However, if desired, you can customize this schedule according to your specific requirements.
Conclusion
In conclusion, every server administrator must understand the importance of setting up Nginx logs and implementing logrotate. Following the article’s steps, you can easily configure your logs and ensure they are properly rotated.
This prevents any potential problems caused by unmanaged log files. Proper logging and rotation practices are crucial for maintaining server stability and security. It’s essential to stay updated with best practices to guarantee the smooth functioning of your server.
Meet Aayush Nair, a WordPress website designer with almost a decade of experience who doesn’t only craft visually appealing websites but also has a knack for writing engaging technology blogs. In his spare time, he enjoys illuminating the minds around him.
