Introduction
This article provides an overview of the Webdock dashboard, including server management, event tracking, team access control, script execution, monitoring configuration, and account management.
Our Dashboard
The dashboard is the central interface for managing your infrastructure.
Home
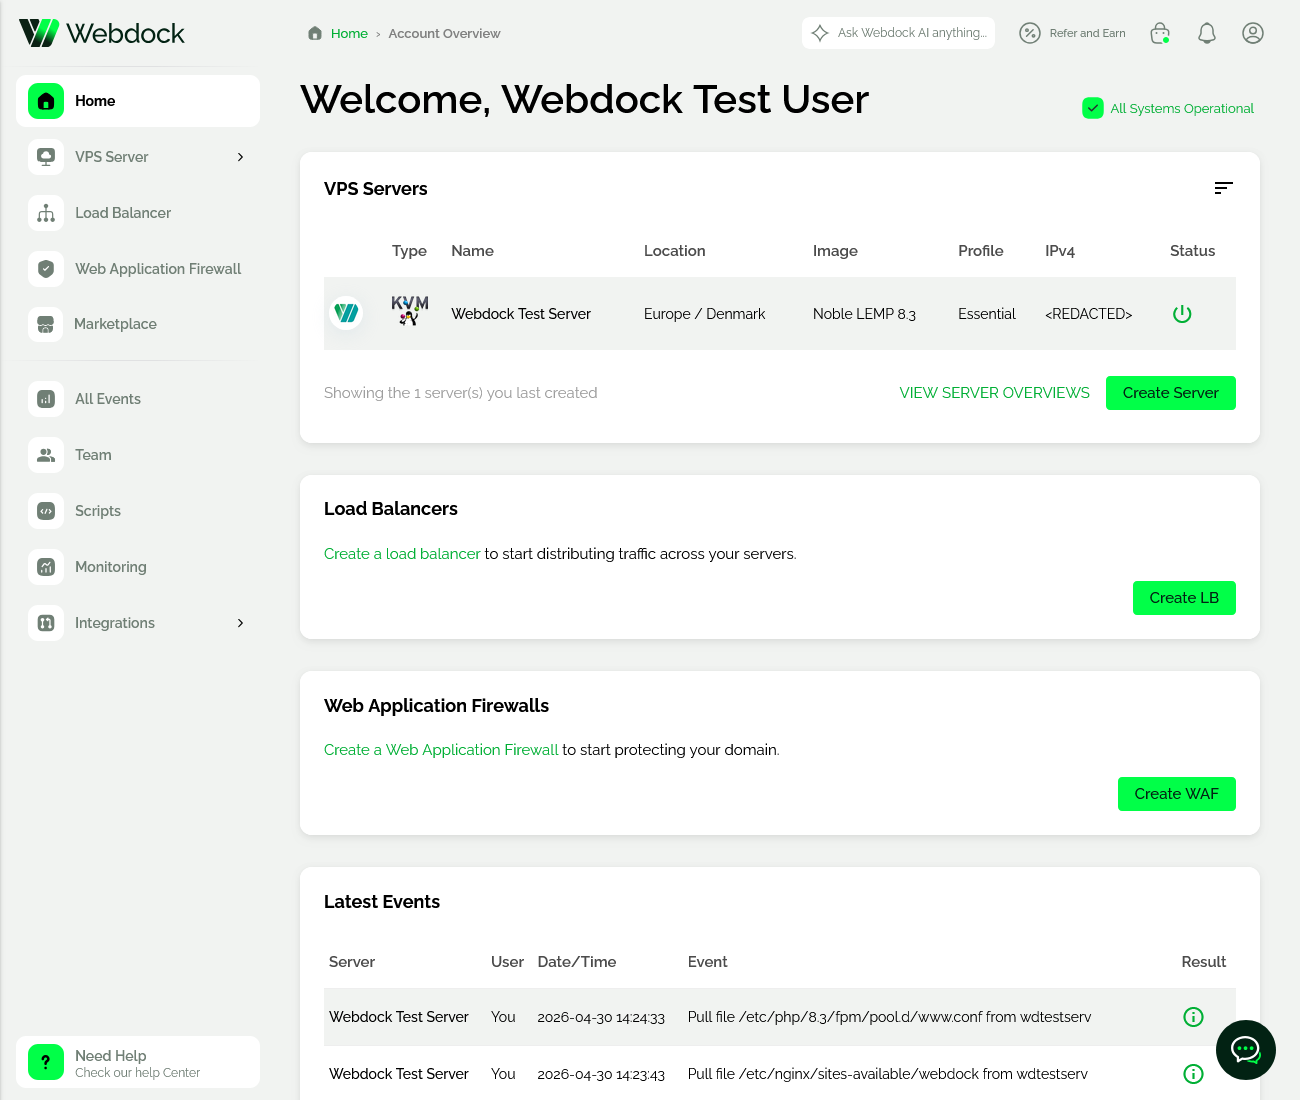
The main workspace displays resource panels that provide summaries and direct actions for managing infrastructure components.
VPS Servers
The ‘VPS Servers’ panel displays your newest servers and their information. Use the ‘Create Server’ button to deploy a new server, or select ‘View Server Overviews’ to access detailed server information, including views for resource usage, metadata, archived servers, and snapshots.
Load Balancers
The ‘Load Balancers’ panel provides an overview of your load balancers that allows you to distribute traffic across multiple servers. Use the ‘Create LB’ button to configure a new load balancer.
Learn more about load balancers here.
Web Application Firewalls
The ‘Web Application Firewalls’ panel displays your configured WAF instances used to protect applications from unwanted traffic. Use the ‘Create WAF’ button to define and deploy new firewall rules.
Learn more about web application firewalls here.
Last Events
The ‘Latest Events’ panel displays recent account and server activity, including server name, user, timestamp, event description, and result. It tracks actions such as server creation, deletion, renaming, and snapshot operations.
Menu
Marketplace
The ‘Marketplace’ section provides access to partner services, and exclusive offers available to Webdock users. It allows you to discover additional tools and services that can be used alongside your infrastructure and applications.
Learn more about the marketplace here.
All Events
The ‘All Events’ section provides a complete and searchable log of all account and API activity. It allows you to review detailed records of actions such as server operations, configuration changes, and automated processes across your infrastructure.
Team
The ‘Team’ dashboard manages invited users and their permissions for performing actions within your account.
Learn more about teams here .
Scripts
The ‘Scripts’ section allows you to upload and manage scripts for use across servers. Scripts uploaded here can be deployed and run on multiple servers directly from the dashboard without using SSH.
Learn more about the script library here and deployment here.
Monitoring
The ‘Monitoring’ section allows you to configure monitoring rules for your servers. For example, you can define a ping check to monitor availability and receive email notifications if the check fails.
Learn more about monitoring, and how to set it up here .
The Top Right Buttons
In the top-right corner, the dashboard includes ‘Ask Webdock AI’ for assistance, a notifications center for ongoing and completed events, and the ‘Account’ menu, which includes account settings, billing, and the ‘Logout’ button.
Help Center
The ‘Need Help’ button in the bottom-left corner provides quick access to the Help Center. It offers user-focused support features, including AI chat assistance, direct contact with support, documentation search, and a Frequently Asked Questions section to quickly resolve common issues.
The Help Center also provides technical and product resources, including access to the Webdock API, the public roadmap for upcoming features, and a feature request system for submitting and tracking improvements.
Server Overview
Clicking a server from the dashboard opens the ‘Server Overview’ screen, which provides detailed information and quick management actions for the selected server.
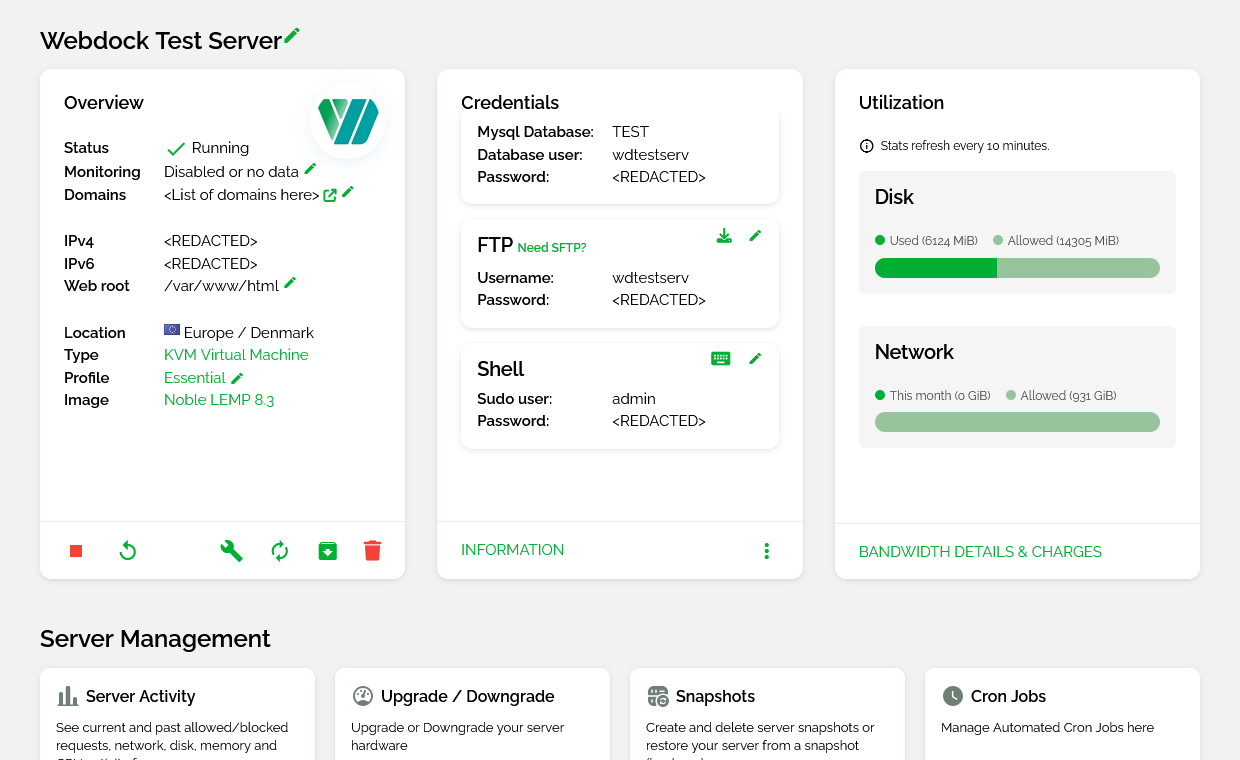
The ‘Overview’ panel displays general server information, including the current status, assigned domains, server location, IP addresses, and web root configuration.
The ‘Credentials’ panel provides access to generated service credentials for configured services on the server. Additional information can be viewed by expanding the panel using the ‘Information’ option.
The ‘Utilization’ panel displays current disk and network bandwidth usage. Additional bandwidth usage information, and overage charges can be viewed by clicking ‘Bandwidth Details & Charges’.
Quick action controls are available directly from the overview screen for common operations such as starting, stopping, and cancelling/deleting the server, opening rescue access tools, restarting services, accessing WebSSH sessions, and performing recovery-related actions.
Below the overview area, the ‘Server Management’ section provides access to additional server management and configuration tools. More information can be found here.
Conclusion
The Webdock dashboard provides a centralized interface for managing servers, networking components, security features, and operational activity. It enables efficient control and visibility across your infrastructure from a single workspace.
