Introduction
Monitoring uptime is essential for keeping your websites and applications accessible. This availability is key to ensuring customer satisfaction and building loyalty. When your business experiences downtime, you risk losing revenue and damaging your reputation.
Uptime monitoring also provides valuable insights into your system's performance. By identifying issues early, you can address them before they escalate and impact user experience. Regular monitoring helps you recognize traffic trends and resource usage, which supports your planning for capacity needs.
While many solutions exist, most are too expensive or frequently change pricing. Alternatively, self-hosting your uptime monitors gives you greater control over the amount you spend. This approach enhances data privacy since sensitive information remains within your infrastructure, reducing third-party risks. Moreover, avoiding ongoing subscription costs can save you money in the long run.
Uptime Kuma is a free, self-hosted tool for monitoring the uptime of different services and applications. It features an easy-to-use web interface, making it simple to monitor your services and receive alerts if they go offline. This guide will walk you through the step-by-step process for installing Uptime Kuma on your Ubuntu machine. Let’s proceed without further ado.
Prerequisites
- A Webdock Ubuntu Server (Ubuntu Jammy or later)
- SSH access to your server
Installing Node.js
There are two ways to install Uptime Kuma: Docker and Node.js. I am going to take the latter route because it is easier and lighter than running a docker container.
Goes without saying; you will need an empty Ubuntu server with sudo access. First, it's important to make sure that your system's package index is current and that all installed packages are upgraded to their latest versions. Open your terminal, and log in as a sudo user.
And, run this command:
$ sudo apt update && sudo apt upgrade -y
This command will update the package list and upgrade any packages that are out of date.
Uptime Kuma depends on Node.js, npm (Node Package Manager), and Git. Let's install these necessary dependencies. Run the following command in your terminal:
$ sudo apt install curl git -y
Uptime Kuma performs optimally with Node.js version 16 or newer. I am going to use Node.js’ latest stable version, v22. To install Node.js, you’ll need to add the NodeSource repository. Run the following command:
$ curl -fsSL https://deb.nodesource.com/setup_22.x -o nodesource_setup.sh
And run the script:
$ sudo -E bash nodesource_setup.sh
Next, install Node.js and npm by executing:
$ sudo apt install nodejs -y
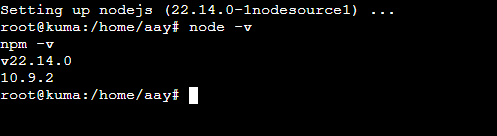
Once the installation is complete, it’s important to verify that Node.js and npm are installed correctly. You can check their versions by running the following commands:
$ npm -v
$ node -v
You should see an output displaying the versions of Node.js and npm that are installed on your system.
Install And Configure Uptime Kuma
Next, you'll download Uptime Kuma from its GitHub repository. Start by navigating to your home directory and cloning the repository using Git:
$ cd ~
$ git clone https://github.com/louislam/uptime-kuma.git
After cloning the repository, change into the Uptime Kuma directory with the following command:
$ cd uptime-kuma
Once you're in the Uptime Kuma directory, install its dependencies using npm. Run the following command:
$ npm run setup
This command will download and install all the necessary packages for Uptime Kuma to work correctly. Depending on your internet speed, the process might take a few minutes.
If you see several depreciation notices, the author says it is okay to ignore them.
Uptime Kuma includes a default configuration, but you might customize it to fit your specific needs. The configuration file is located at config/config.yml. Open it using your preferred text editor:
$ sudo nano config/config.yml
In this file, you can adjust settings such as port number (default is 3001). You may also change the database configuration. Uptime Kuma uses SQLite for data storage by default, which works well for smaller deployments. If you’re planning for larger setups, you might want to consider using MySQL or PostgreSQL.
After you’re happy with the changes, make sure to save the configuration file. You can launch Uptime Kuma by running this command:
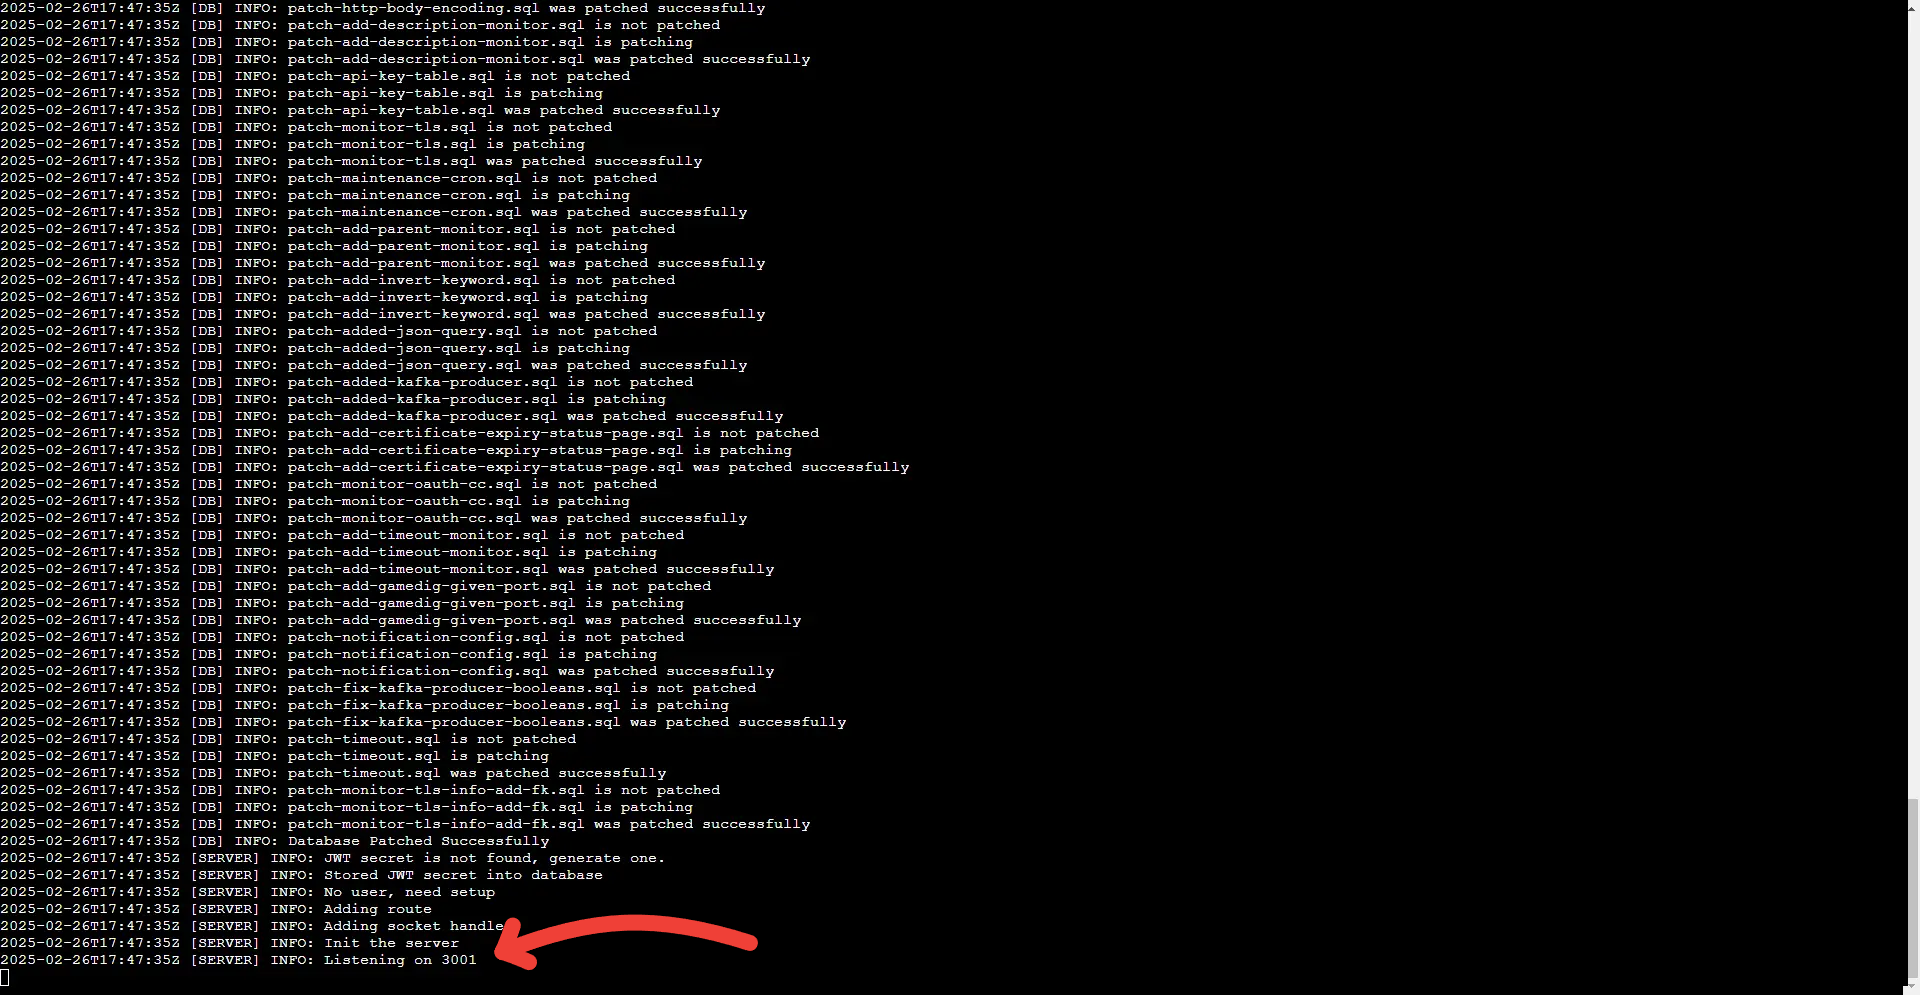
$ npm run start
Once you execute this command, you should see a message indicating that the application is now up and running.
Run Uptime Kuma In The Background
It’s a good idea to use a process manager like PM2 to keep Uptime Kuma running in the background even after you close your terminal. PM2 serves as a handy process manager for Node.js applications. It helps you manage and monitor your apps with ease.
With PM2, you can take advantage of features like automatic restarts to keep your application running smoothly, load balancing to distribute traffic efficiently, logging to track events, and clustering to enhance performance. These capabilities ensure that your Node.js services remain reliable and perform well in real-world use.
First close the current process by pressing CTRL/CMD + C. Then, start by installing PM2 globally with this command:
$ sudo npm install pm2 -g
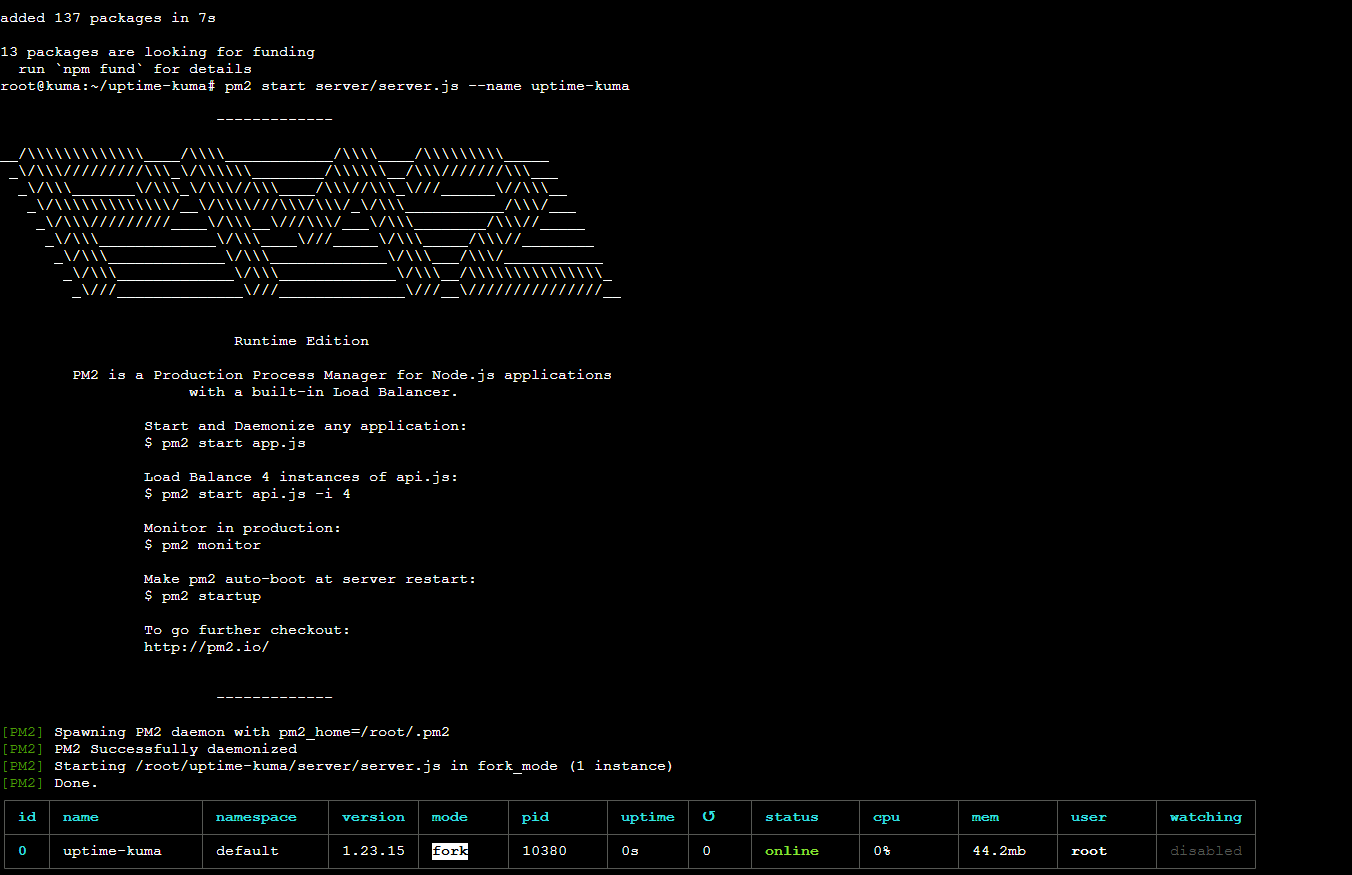
Next, launch Uptime Kuma using PM2:
$ pm2 start server/server.js --name uptime-kuma
If you want Uptime Kuma to start automatically when your system boots up, run the following commands:
$ pm2 startup
$ pm2 save
Adding Monitors
After Uptime Kuma is running, you can access it using your web browser. Simply open your browser and type in the following URL:
http://your_server_ip:3001
Make sure to replace your_server_ip with the actual IP address of your server. If everything is configured properly, you'll see the Uptime Kuma web interface appear.
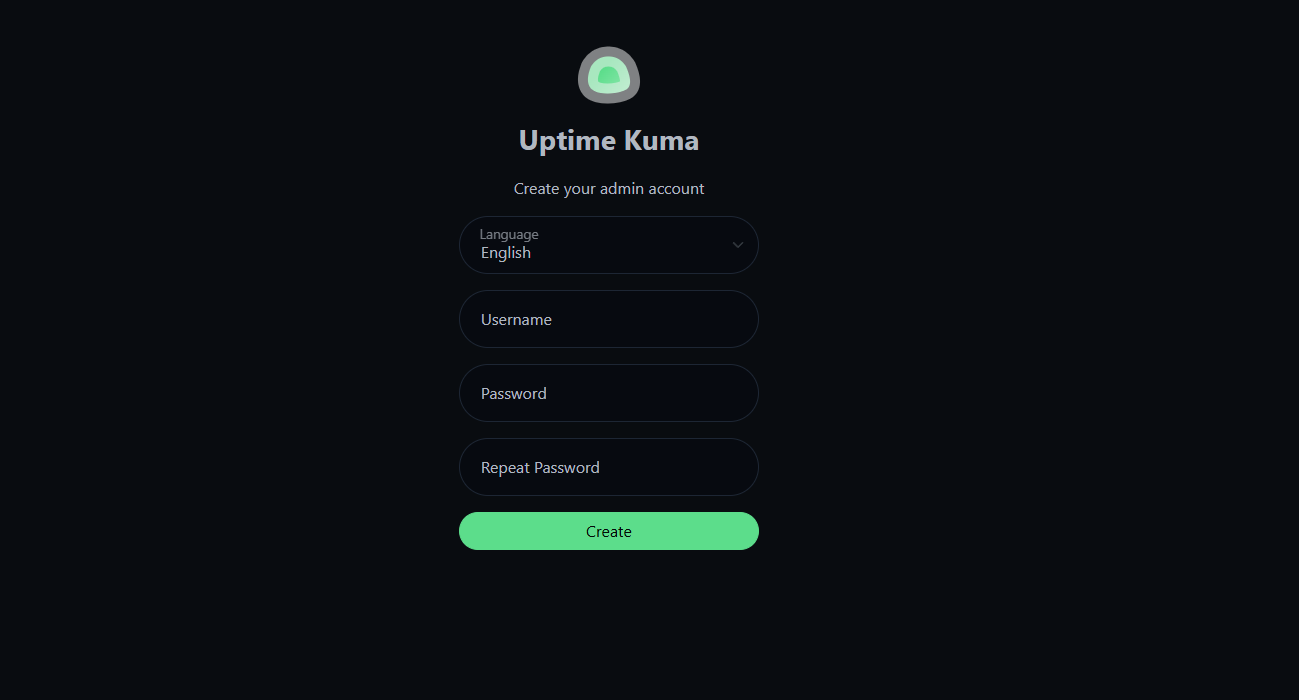
When you access your Uptime Kuma instance for the first time, you’ll be prompted to create an account and set up your instance. Enter your desired admin username and password, then click on “Create.”
After that, you’ll be directed to the Uptime Kuma dashboard, where you can start managing your monitors. Start adding monitors for the various services you want to track:
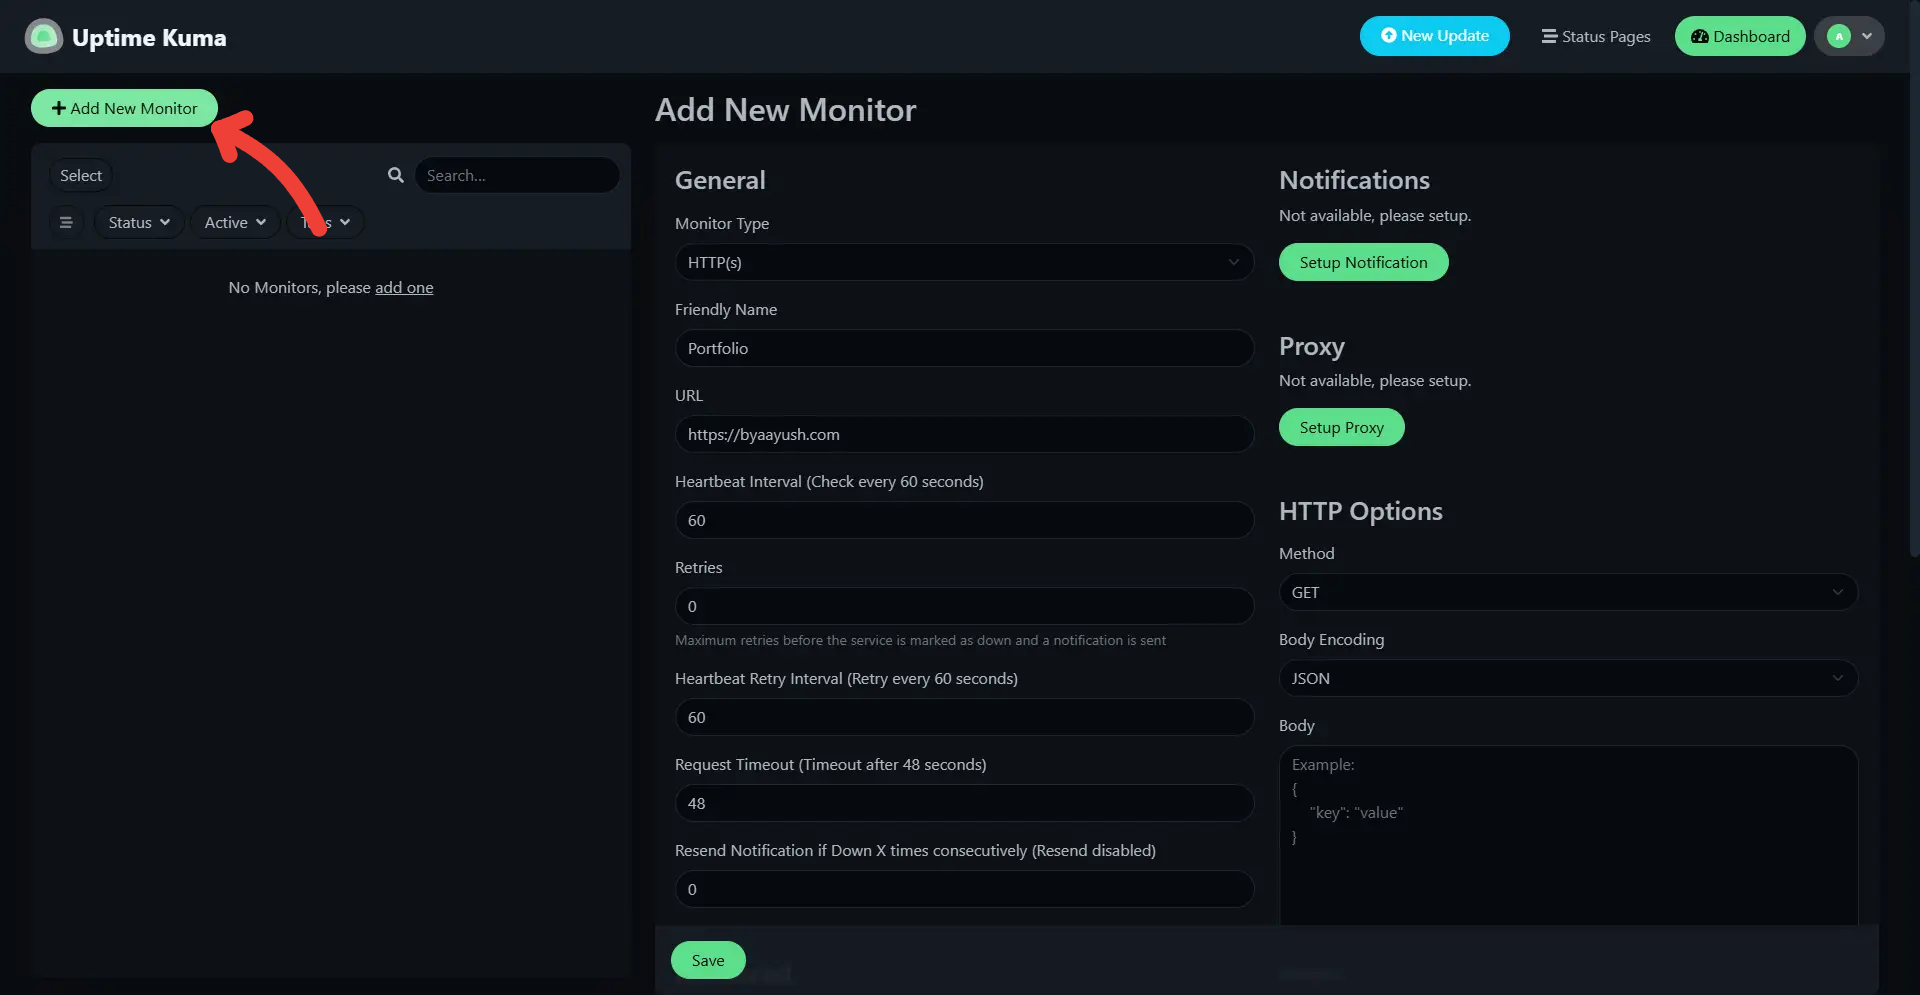
- In the Uptime Kuma dashboard, click on Add New Monitor.
- Fill in the required details:
- Friendly Name: Give it a name that makes it easy to identify.
- URL: Enter the URL or IP address of the service you want to monitor.
- Type: Select the type of monitor from options like HTTP(s), TCP, ICMP Ping, etc.
- Adjust additional settings, such as the monitoring interval and timeout.
- Click Save to add the monitor.
You can repeat these steps for each service you’d like to keep an eye on.
Set Up a Reverse Proxy (Optional)
Using a reverse proxy with your Uptime Kuma setup has some great benefits. One of the main perks is that you can create a straightforward and catchy domain name. Instead of asking users to remember a long IP address or port number, they can simply type in your custom domain, making it much easier for them to access the monitoring service.
Another advantage is the ability to show a public status page. This allows you to present uptime and performance information to users and stakeholders, which can help foster trust and keep everyone updated on service reliability.
Also, a reverse proxy can enhance how you manage access and user authentication. It gives you the ability to enforce security measures, ensuring that only authorized users can enter the Uptime Kuma dashboard while providing a clean interface for public visitors.
To enable access to your Uptime Kuma instance through standard HTTP/HTTPS ports (80/443), you can set up a reverse proxy with Nginx. Here's how to do it:
First, install Nginx by running:
$ sudo apt install nginx -y
Next, create a new configuration file specifically for Uptime Kuma:
$ sudo nano /etc/nginx/sites-available/uptime-kuma
Then, add the following configuration to set up Nginx as a reverse proxy:
server {

    listen 80;

    server_name your_domain;

    location / {

        proxy_pass http://localhost:3001;

        proxy_http_version 1.1;
        proxy_set_header Upgrade $http_upgrade;
        proxy_set_header Connection 'upgrade';
        proxy_set_header Host $host;
        proxy_cache_bypass $http_upgrade;

    }

}
Make sure to replace your_domain with your actual domain name, and the domain name has an A/CNAME record pointing to your server.
Save by clicking CTRL + X and then Y. To activate the new configuration, you'll need to create a symbolic link in the sites-enabled directory and then restart Nginx. Run the following commands:
$ sudo ln -s /etc/nginx/sites-available/uptime-kuma /etc/nginx/sites-enabled/
Next, check the configuration for any errors:
$ sudo nginx -t
Finally, restart Nginx to apply the changes:
$ sudo systemctl restart nginx
You can now access Uptime Kuma through your domain without needing to specify port 3001.
To secure your Uptime Kuma installation with SSL, you can use Certbot to get free SSL certificates from Let's Encrypt. Start by installing Certbot. For that, we will need snapd:
$ sudo apt update && sudo apt install snapd -y
Then, install Certbot:
$ sudo snap install --classic certbot
Once installed, run Certbot to automatically set up SSL for Nginx:
$ sudo certbot --nginx -d your_domain.com
Do remember your domain should be pointing to the server's IP, or this operation will fail. Follow the prompts that Certbot provides to finish the installation. You may need to provide some information like email to move forward.
Certbot will also create a cron job to automatically renew your certificates. However, it's a good idea to check that this process works correctly:
$ sudo certbot renew --dry-run
This command will simulate the renewal process to confirm that everything is functioning properly. Now, your Uptime Kuma instance will be available on an easy-to-remember domain and fully secure with an SSL certificate.
Configuring Notifications (Optional)
Uptime Kuma lets you set up notifications to keep you informed when services go down or come back online. You can choose from several channels for notifications, including Discord, Slack, email, and others. This way, you can stay updated on the status of your services in real time.
In this tutorial, I am going to explore the simplest, quickest mode of notifications: emails. Do notice that most hosts, including Webdock, block the default ports to send emails (Port 25, 587, and 465) because of abuse and spam concerns, so you will need an external email-sending service.
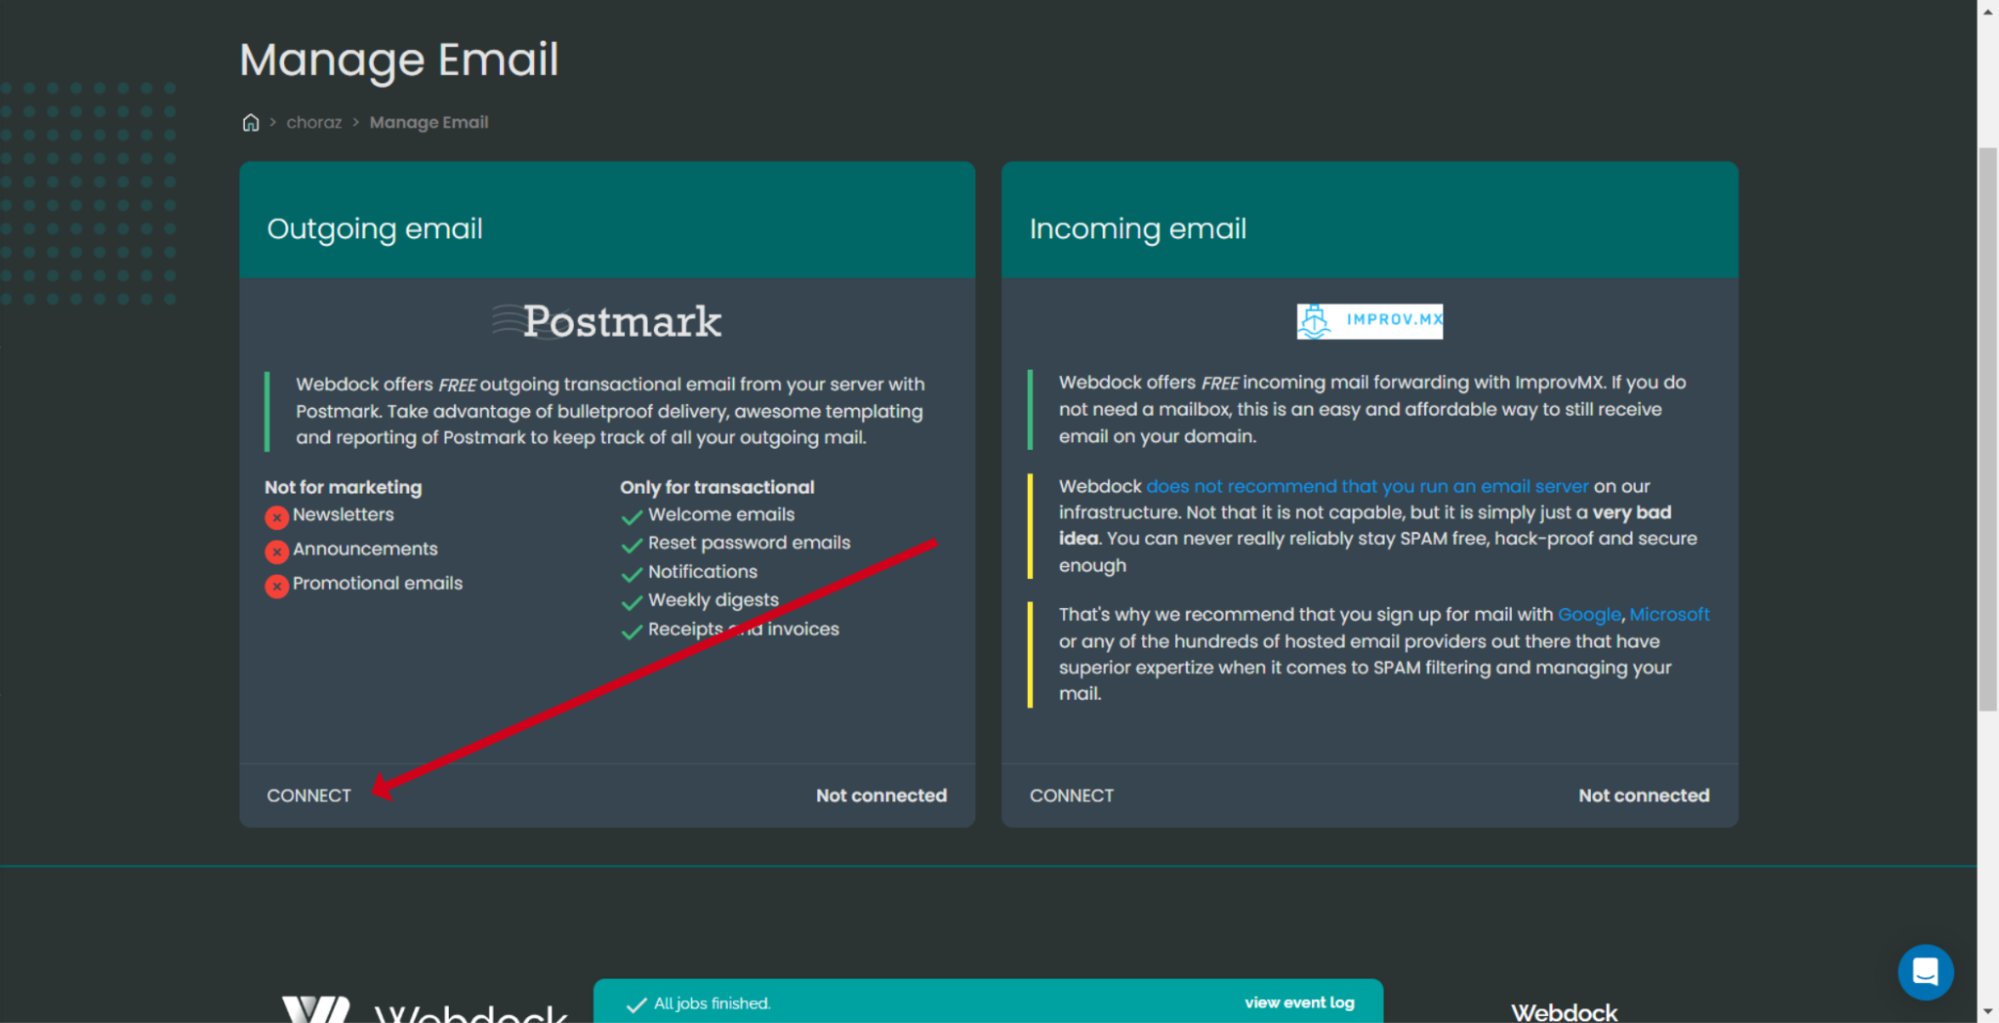
If your Webdock server has access to the Postmark add-on you can use it for notification emails. Postmark is a highly regarded transactional email-sending solution available today with one of the highest delivery rates.
You can integrate Postmark into your project and send unlimited transactional emails, with Webdock covering all associated costs. Additionally, you benefit from generous backup options. These features can lead to significant savings for your organization.
That being said, let's see how you can enable email notifications on Uptime Kuma by using the Postmark add-on.
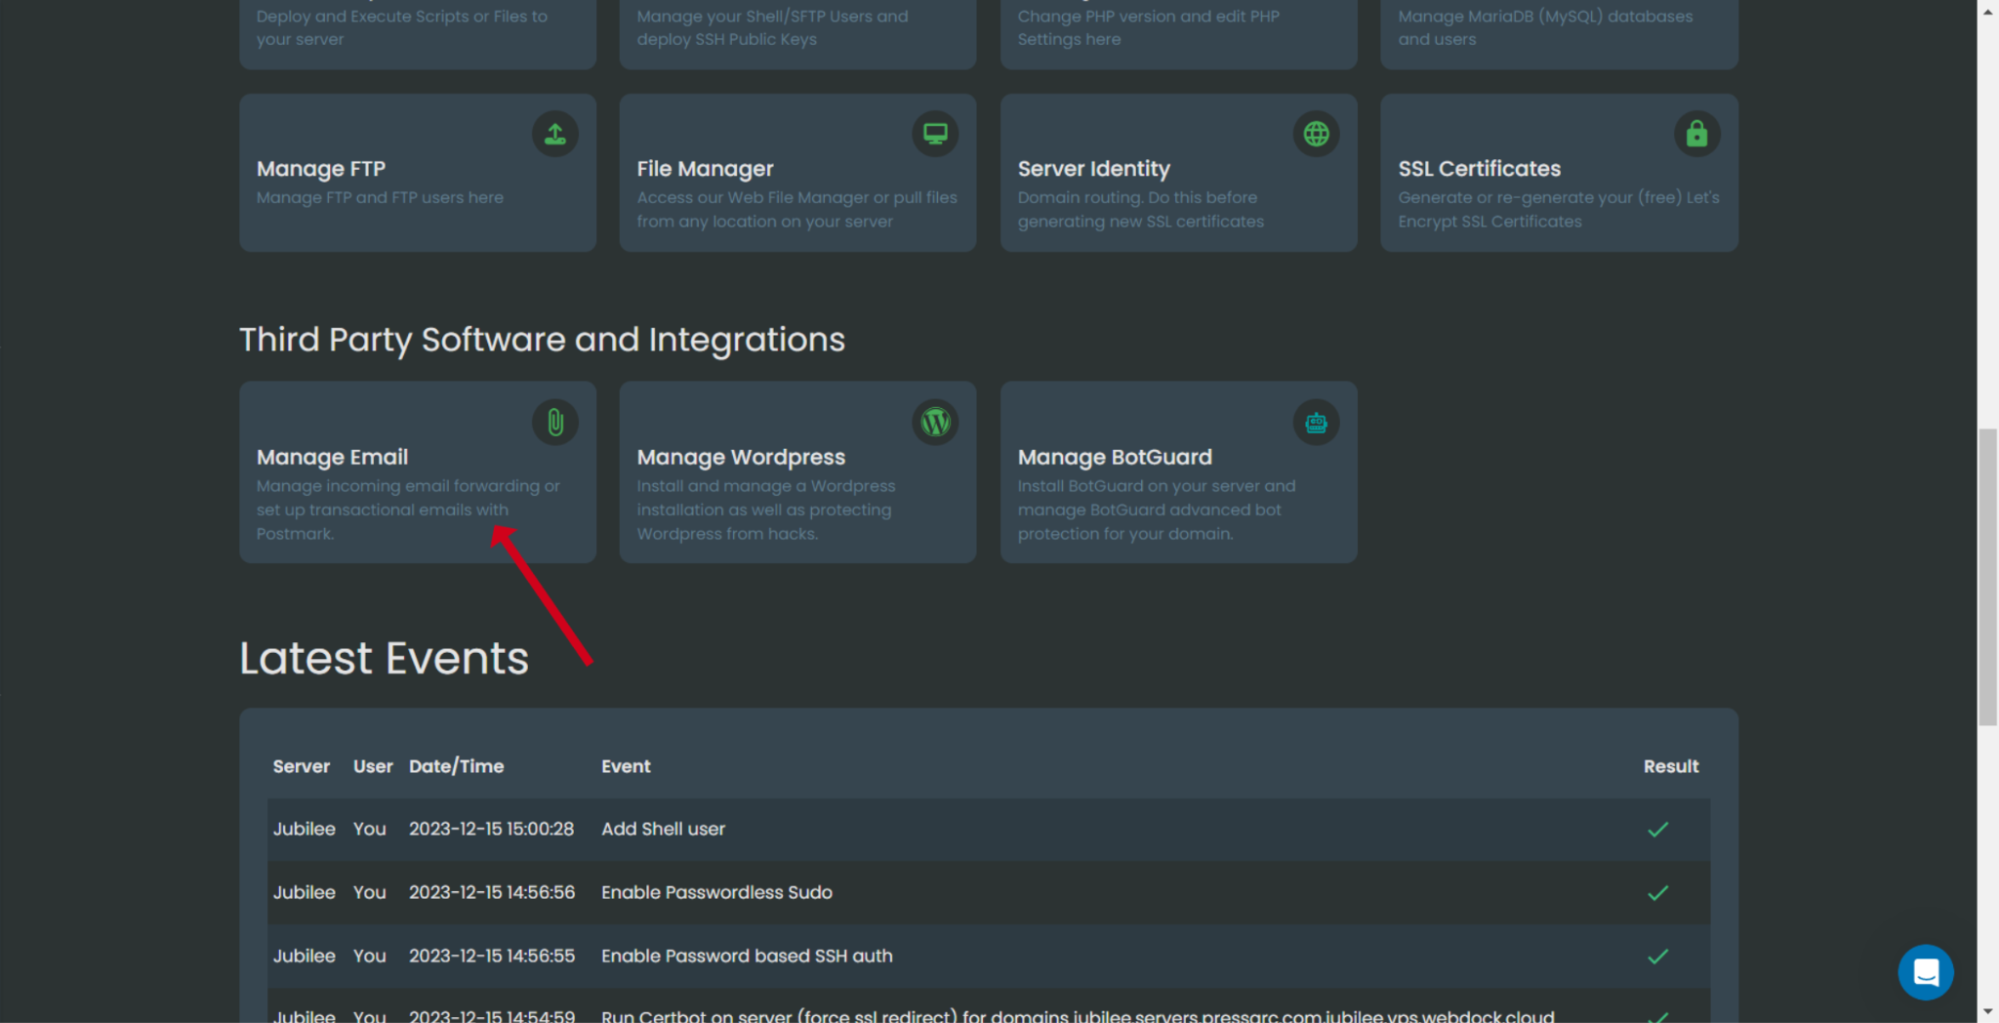
To set up your email sender, head to your server’s control panel. Find the “Manage emails” section and request permission from Webdock to enable this feature. Make sure to commit to using it responsibly.
After approval, click Connect:
To start sending emails with Postmark, you need to add DKIM and return-path records to your DNS provider's site. After updating these records, the verification process could take up to 15 minutes. Once everything is set up, Postmark will send you an email to confirm that the process is complete.
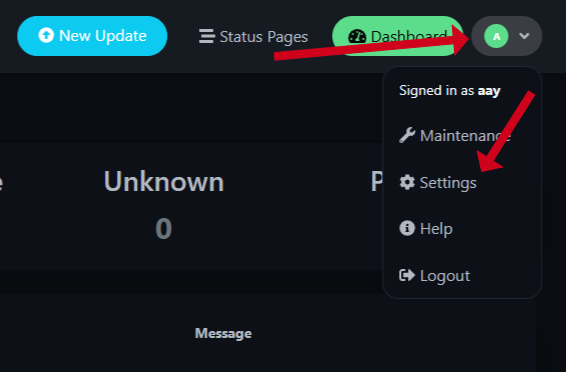
After you verify that Postmark is connected and functioning properly, log into your Uptime Kuma web interface and navigate to Profile > Settings > Notifications.
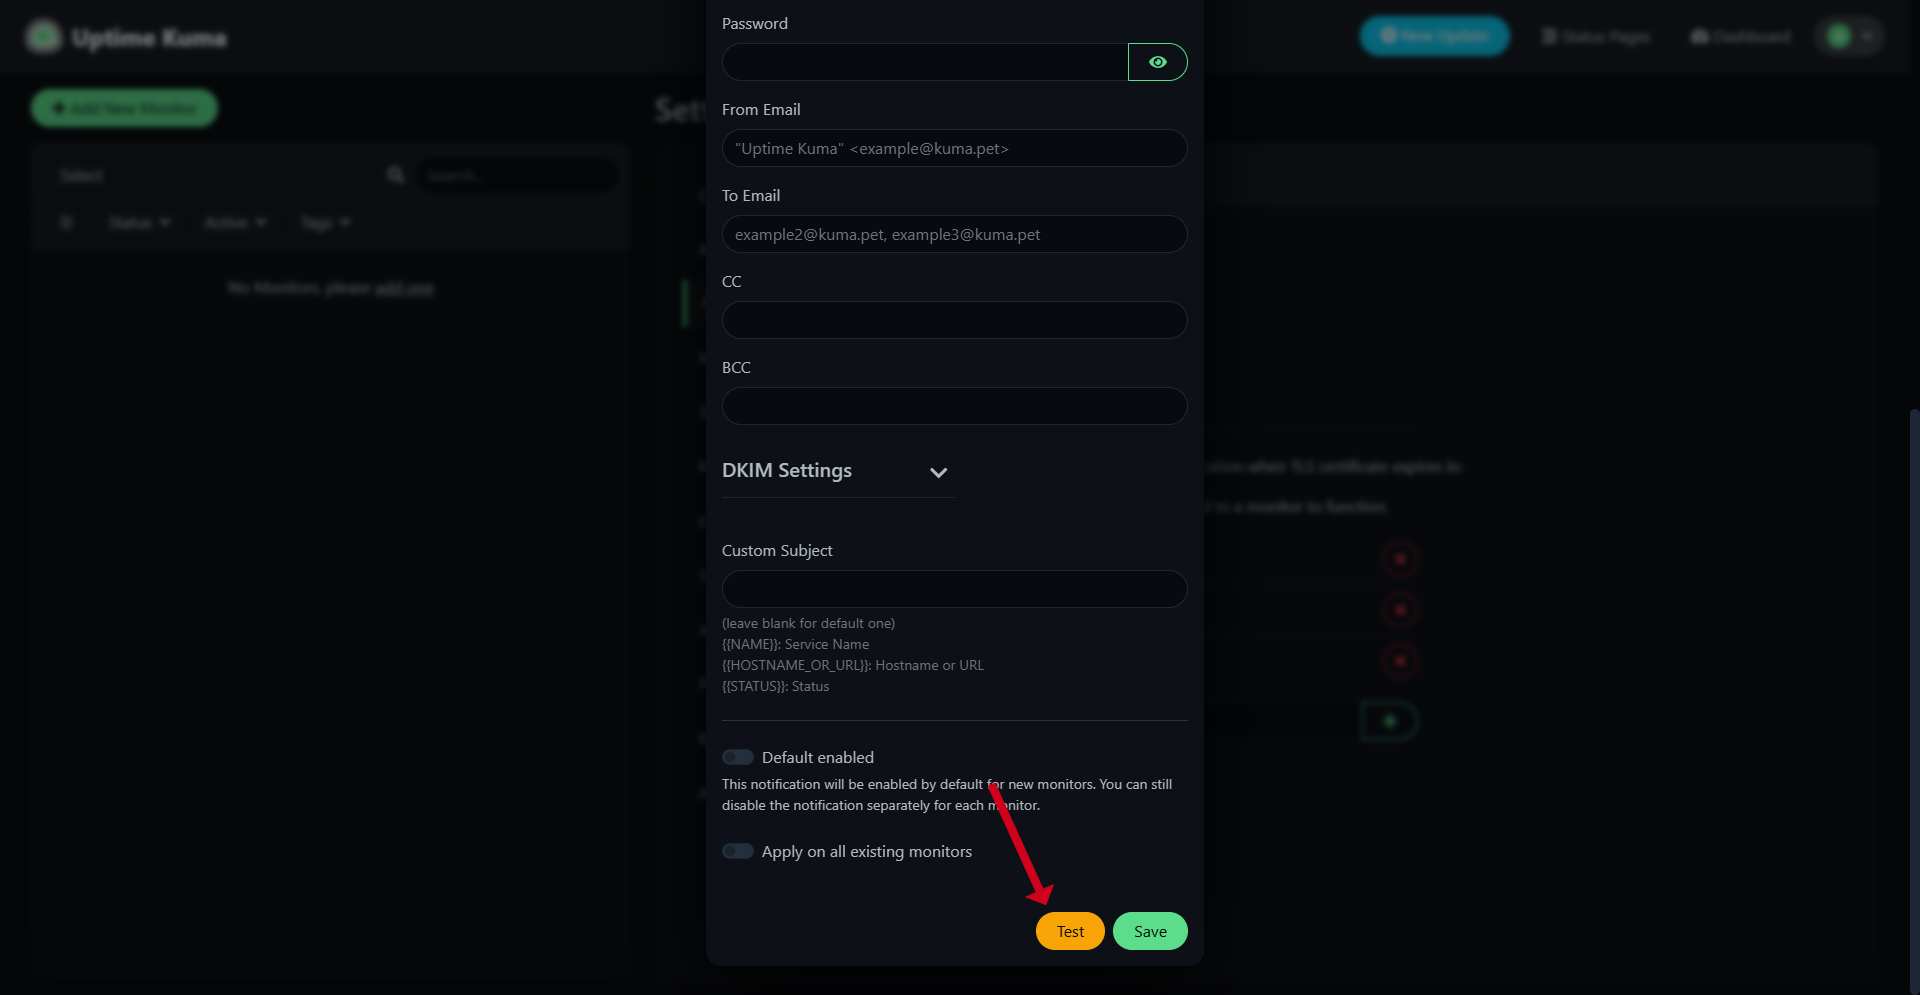
From there, select Email (SMTP) from the available options. Now, from your Postmark dashboard, add the following information to the fields:
- Hostname: smtp.postmarkapp.com
- Port: 587
- Security: None
- Username: [username from your Postmark dashboard]
- Password: [password from your Postmark dashboard]
- From Email: Any email you would like that ends with your domain. I like to use kuma@my_domain
- To Email: Email where you want the notifications
- Optionally, add CC and BCC if you want your team members to be on track as well
You may also add custom subjects to your emails - Then, you can enable this notification method as the default option and retroactively apply it to current monitors.
Once you set these up correctly, send a test email to ensure the notifications actually go through.
In Conclusion
That’s all you need to install Uptime Kuma on Ubuntu and set it up to monitor your services. Now, you can easily manage your monitors using its user-friendly interface and set up notifications to keep you updated on their status without burning a hole through your wallet.
If you're looking for a reliable hosting option for your Uptime Kuma instance, consider Webdock. Webdock provides excellent performance and full access to features like the Postmark email-sending service, which can improve your monitoring without requiring additional money.
Take some time to explore the additional features that Uptime Kuma offers, like advanced monitoring options and personalized notifications. Make sure to regularly check for updates in the repository to keep your installation secure and running smoothly.
If you run into any problems or have questions while setting up or using the tool, don’t hesitate to visit the Uptime Kuma GitHub repository for helpful documentation and support from the community.
Meet Aayush , a WordPress website designer with almost a decade of experience who crafts visually appealing websites and has a knack for writing engaging technology blogs. In his spare time, he enjoys illuminating the minds around him.
